Introduction
The Democratic Party is known for its support from younger voters. I was curious if this trend continued when it came to the officials the Democrats elect. The visualization below shows the age distribution of the members of the House of Representatives and Senate.
Visualization
Source
To gather the data for this visualization I scraped the data from Wikipedia. First, I used the data from the House and then I grabbed the data for the Senate. After scraping the data using Google Sheets, Microsoft Excel and Tableau were used to create this visualization. If you have any questions go ahead and leave me a comment.
It is worth noting that the Wikipedia page on the House only had the year born. The data makes the assumption that all the House members have already had their birthday is certainly not the case. I decided to do it in this way since I could not easily locate a comprehensive list of all representatives birthdays.
If you want to keep up with our surveys and data analysis, be sure to follow us on Twitter and Facebook.
Up Next
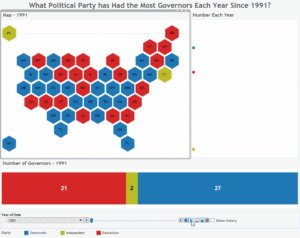
What Political Party has Had the Most Governors Each Year Since 1991?


