Happiness in America: A Data Explorer
What shapes happiness in America? Explore how everyday circumstances, such as age, work, and marriage influence well-being using data.
What shapes happiness in America? Explore how everyday circumstances, such as age, work, and marriage influence well-being using data.
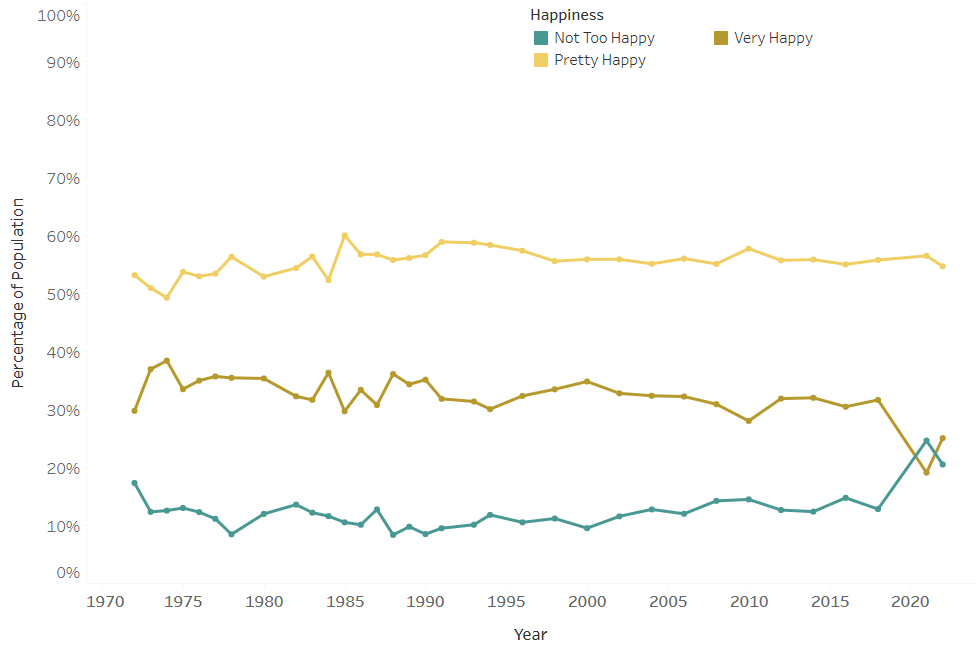
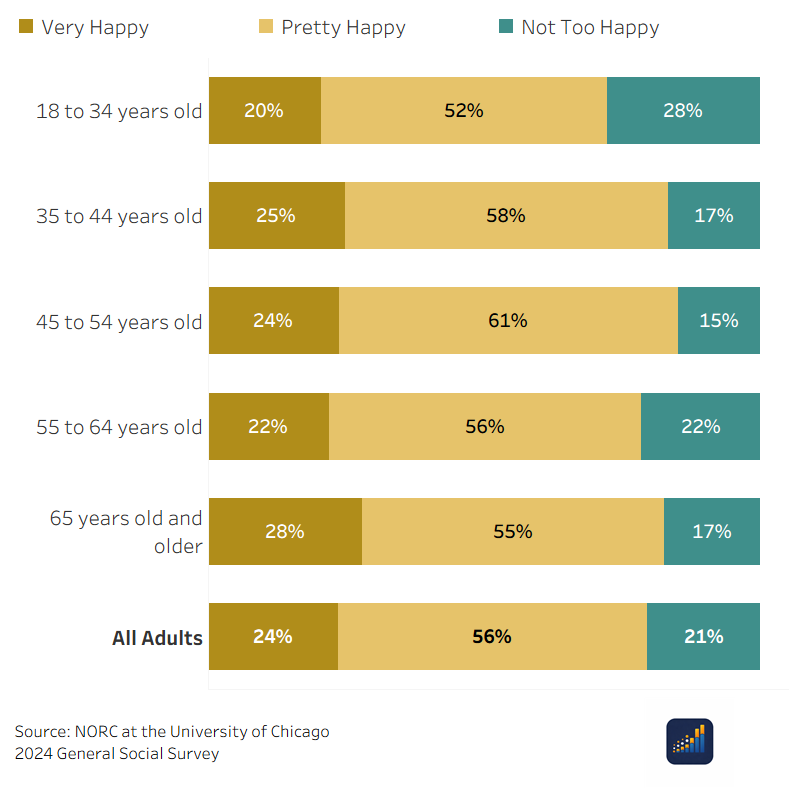
Overall people seem less happy than ever, but they may be happier than you think. In this viz we look at the chaning dynamics of being “Happy.”
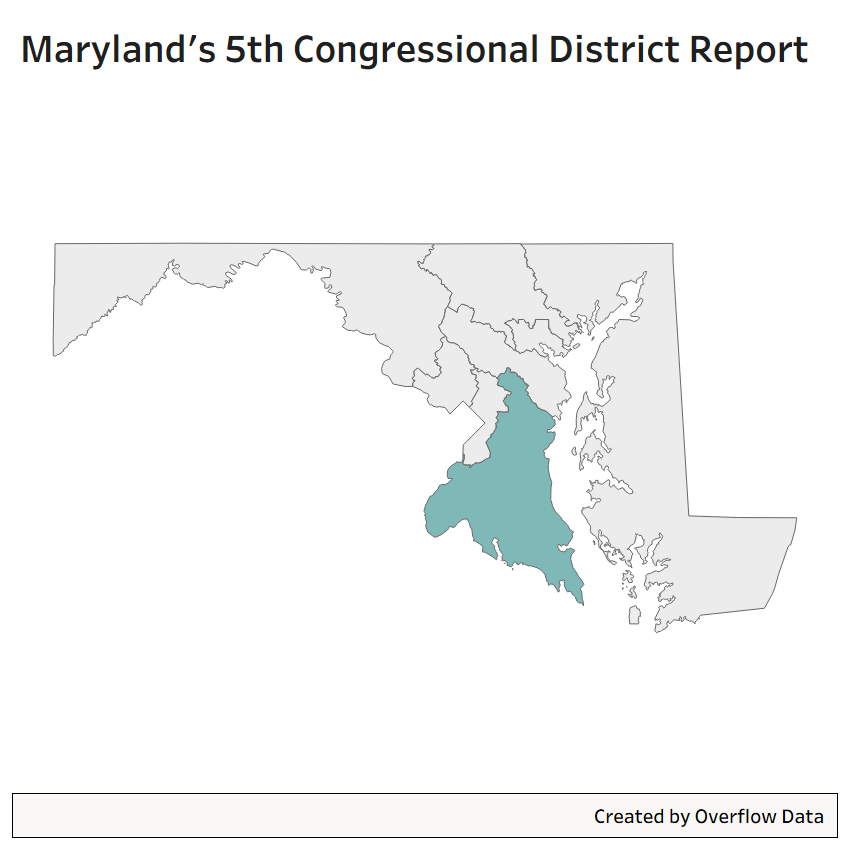
Maryland’s 5th Congressional District explained through data. From who lives here to how people vote.
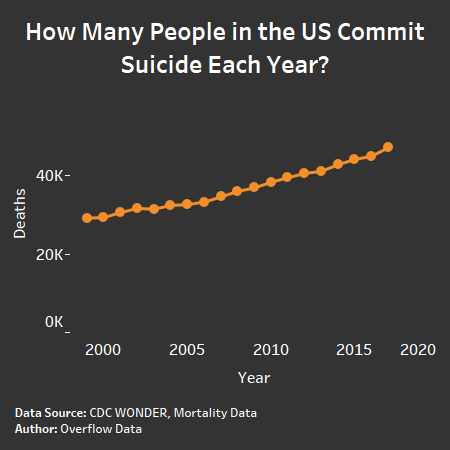
In America, for every 7,000 people, one person committs suicide yearky. This data viz explores how suicides are becoming more prevalent in the United States.
Copyright © 2026 | WordPress Theme by MH Themes