Visualization
Data Notes
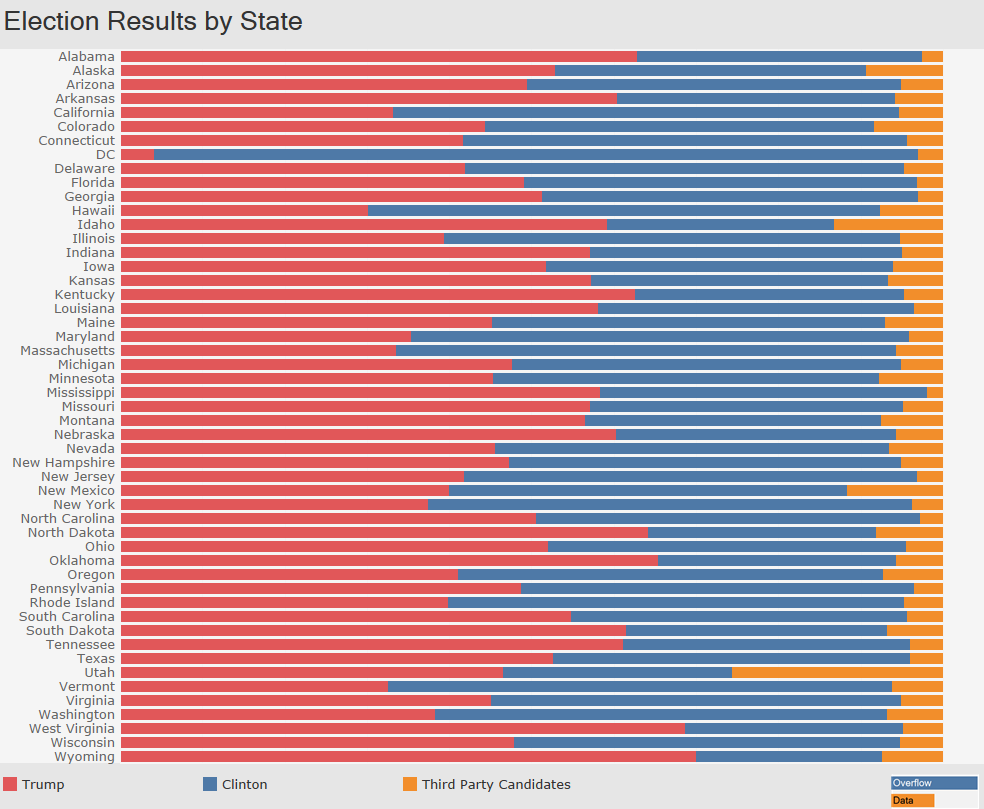
I got tired of seeing the election results with only Republican and Democrat vote totals so I created this graphic. It uses Tableau to show what the results were in each state for the two major parties and the third party candidates. I found the data at reddit.com/r/dataset from u/Prooffread3r. He pulled the election results from Politico’s website. Here is a link to the github page and his website.
If you want to keep up with our surveys or data analysis be sure to follow us on Twitter and Facebook.
Election Results by State with Third Party Candidates #dataviz https://t.co/O9wmVecCnM pic.twitter.com/TgFz6XveRs
— Overflow Data (@overflow_data) November 17, 2016
