
Visualization
Data Notes
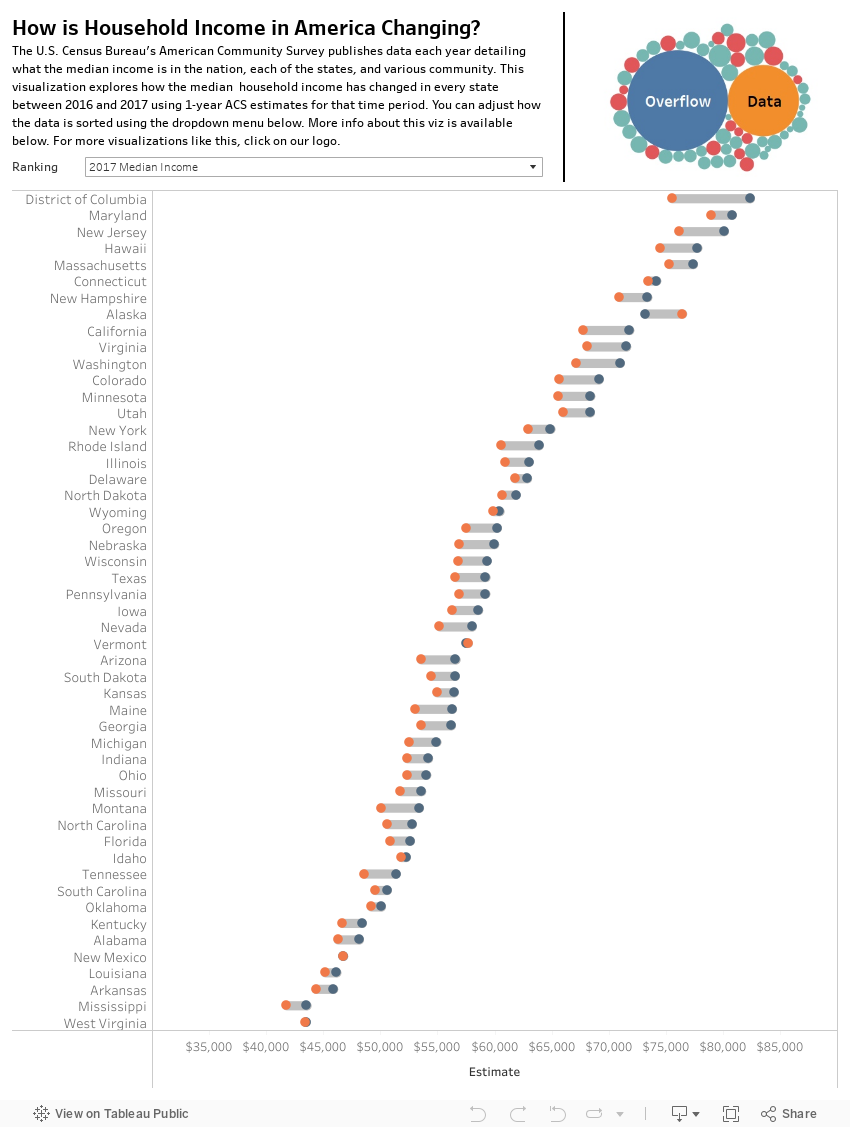
This data visualization explores how the median income in each state has changed between 2016 and 2017. The data for this visualization comes from the U.S. Census Bureau’s American Community Survey 1-year estimates for those years. For more information visit https://census.gov/acs
I used R to pull the ACS estimates from the Census Bureau API and Tableau to create the visualization.
This visualization is a remix of a visualization I saw on Tableau Public. Joshua Preston had posted a visualization that used data from US News’s state rankings to make a similar graphic. I used a similar design when setting up this visualization.
If you want to keep up with our surveys and data analysis, be sure to follow us on Twitter and Facebook.
How is Household Income in America Changing? #dataviz https://t.co/R3Jt6h4XAj
— Overflow Data (@overflow_data) July 2, 2019
Leave a Reply