Introduction
The American Community Survey released its most recent data for 5 year estimates December 3rd for 2010-2014. With release there were estimates on the median income for every county in the US. Below you are able to find visualizations representing that data, along with links to interactive versions of these graphics.
Visualizations
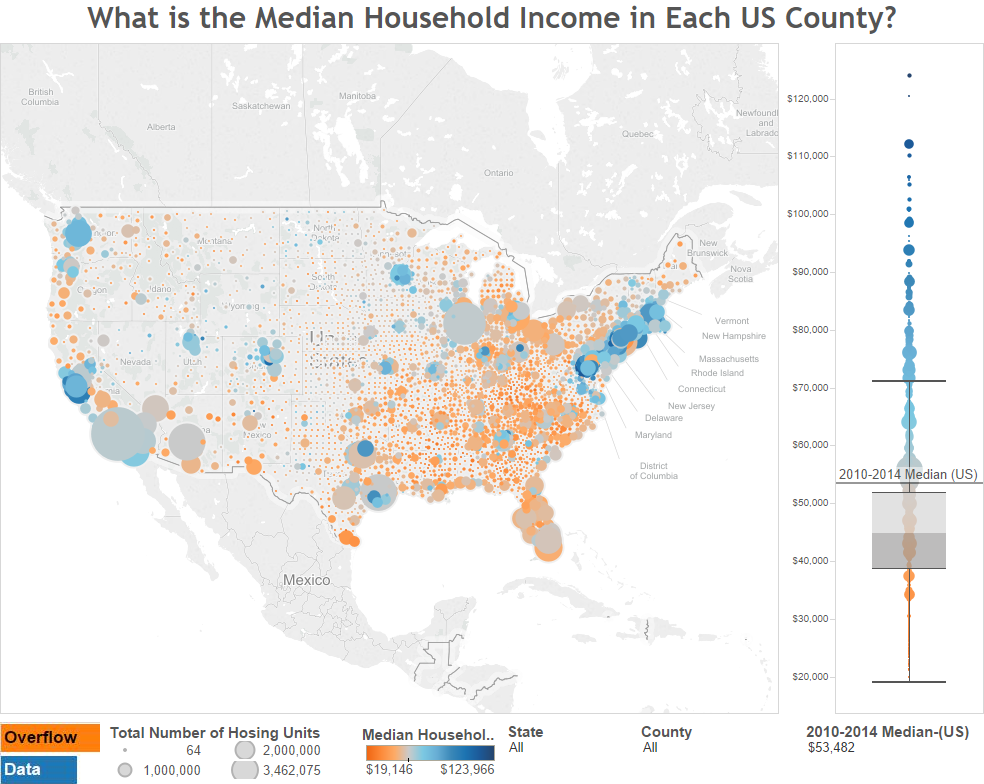
Want to take a closer look or utilize the filters? Click here to view an interactive version of this visualization.
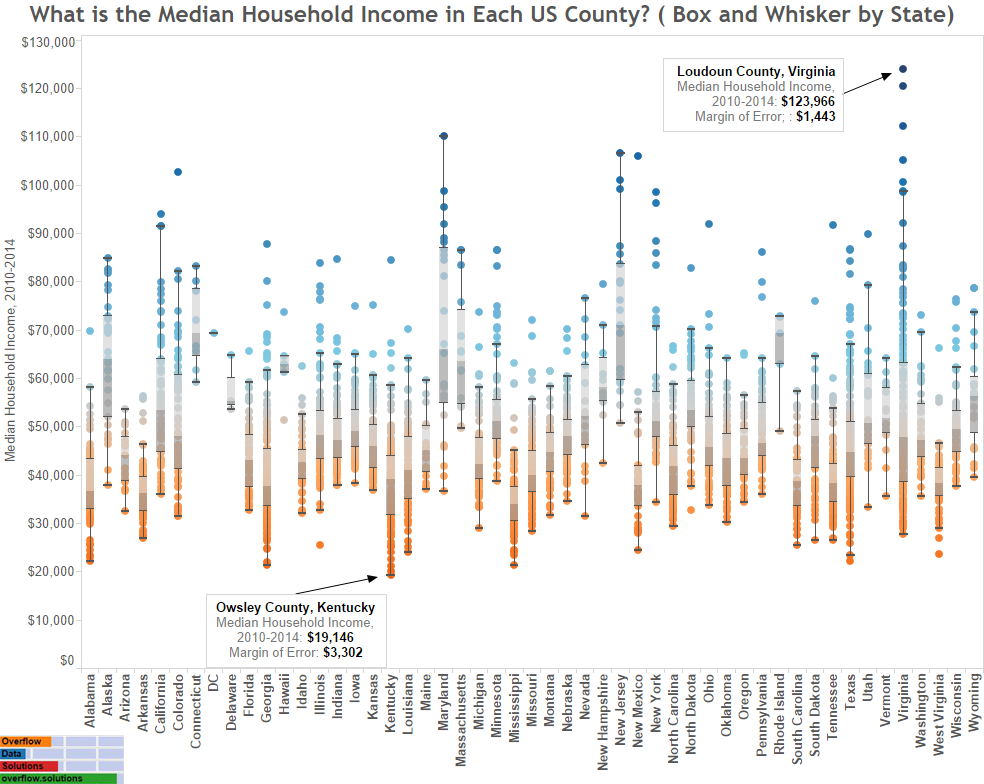
The interactive version of this visualization with individual information about each county is located here.
Quick Analysis
It appears that median income continues to be what you would expect, where you would expect it. Metro areas continue to have higher incomes that that of rural communities. This is most likely accompanied by a higher cost of living though. If you have any thoughts or analysis you would like to share, be sure to share it below.
Source
The data for this visualization comes from the American Community Survey with is conducted by the United States Census Bureau. The data set can be found at http://factfinder.census.gov. It is labeled, MEDIAN HOUSEHOLD INCOME IN THE PAST 12 MONTHS (IN 2014 INFLATION-ADJUSTED DOLLARS), Table B19013. The 2010-2014 5 year estimates were used since they are the most recent data available from the American Community Survey that can be used for every county. The visualization is representative of data collected in that time period.
Once the data was downloaded it was manipulated in Microsoft Excel and Access. It was then loaded into Tableau where I rendered the visualizations and added filters.