
Introduction
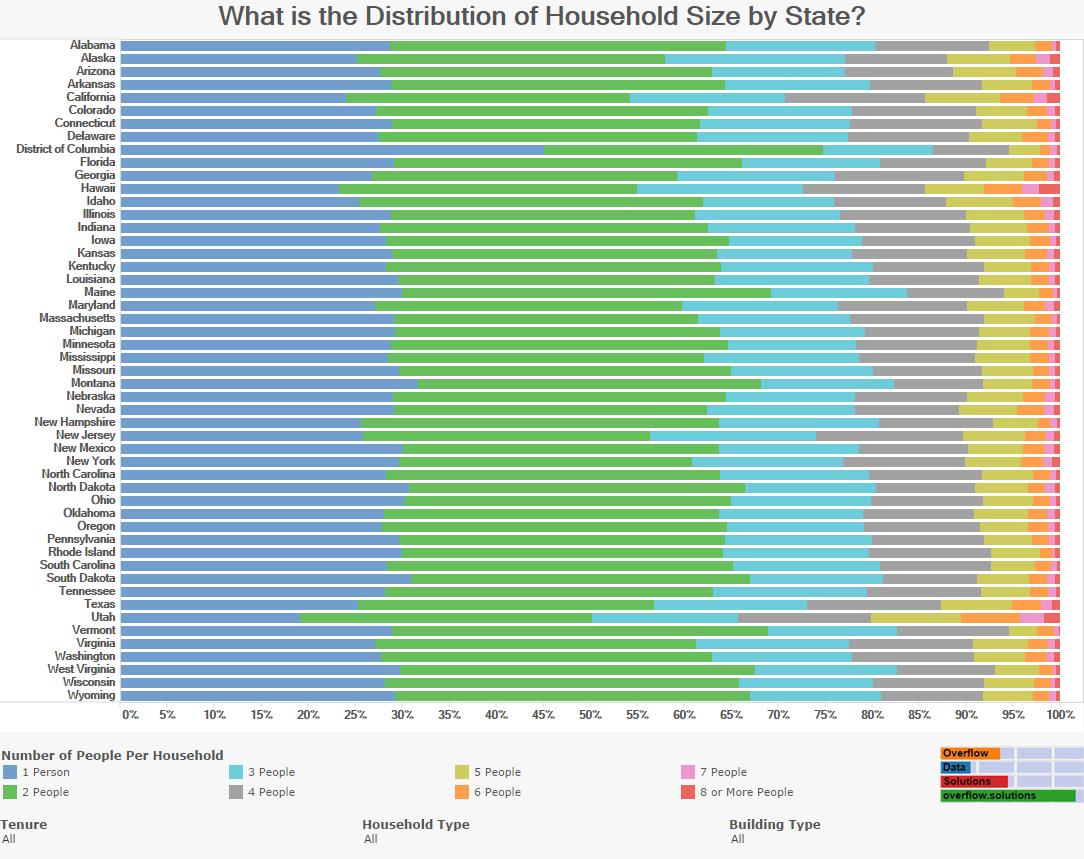
In a visualization I published earlier this week I showed the distribution of household size of the more than 133 million households in the United States. This visualization uses the same American Community Survey data to show the distribution of household size for every state.
Visualization
Note to Mobile Data Users: If visualization is too compressed to enjoy with the vertical view, switch to the horizontal view. The visualization will adjust automatically. If you would like to view a static version of the visualization you can find it here.
Data Notes
The data for this visualization comes from the American Community Survey which is completed by the US Census Bureau. I used the 2014 One Year Estimates Public Use Microdata Sample which can be found on the ACS Website. This visualization uses Tableau to show the proportions of household size in each state.
If you want to keep up with our surveys and data analysis, be sure to follow us on Twitter and Facebook.
Leave a Reply