Introduction
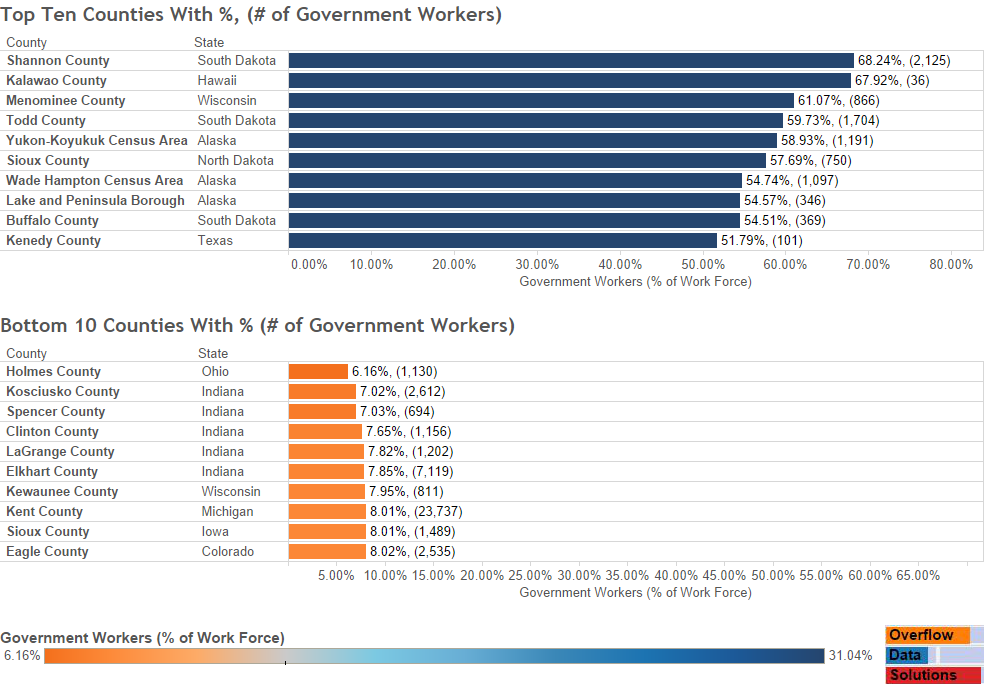
The American Community Survey, a survey conducted by the US Census Bureau, estimates that there are 21,003,247 government workers in the US. This amounts to about 14.6% of the 143,435,233 working Americans.
The visualization below displays these facts, as well as a map, bar chart, and whisker plot that allows you to see more detailed information on where these people work and where they live. Blue represents a higher then average concretion and orange represents a lower then average concentration.
With the interactive visualization, you can filter by county and state so you can see how the different breakdowns in different areas of the country.
Visualizations
Data Notes
As noted above, the data from this visualization comes from the American Community Survey, which is conducted by the US Census Bureau. This along with a slew of other information is available at American Fact Finder. This information came from Table S2408. The 2010-2014 five year estimates were used for this graphic.
The data was edited in excel after it was downloaded to get the information we needed. The visualization was created in Tableau.
If you want to keep up with our surveys and data analysis, be sure to follow us on Twitter and Facebook.
Up Next
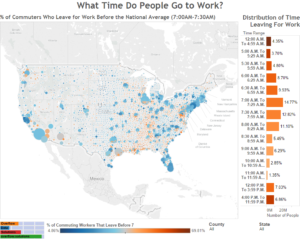
What Time Does The Average American Leave For Work?