
Introduction
Traditional polling is becoming less and less effective, while a desire to predict elections seem to be growing. Many campaigns and pollsters rely on data sets focused on individuals, but this isn’t a luxury available to all individuals interested in campaign data. In this post, I attempt to use county level demographic data, to attempt to model and build profiles on the candidates that received the most votes in the 2016 Republican Iowa Caucus.
Visualizations
Below we have presented 5 different demographic traits for analysis. I hope this will help me determine what traits might best point to what candidate a voter, or in this case, a group of voters, will vote for. The models compares the percentage of the vote received in the county for the candidate and these demographic traits. A regression analysis was performed to determine how good of a fit each model is.They are explained below for the top three finishers in Iowa.
If you are interested in using the interactive version of this model, which contains the other Republican’s and the ability to filter through these traits you can find it here.
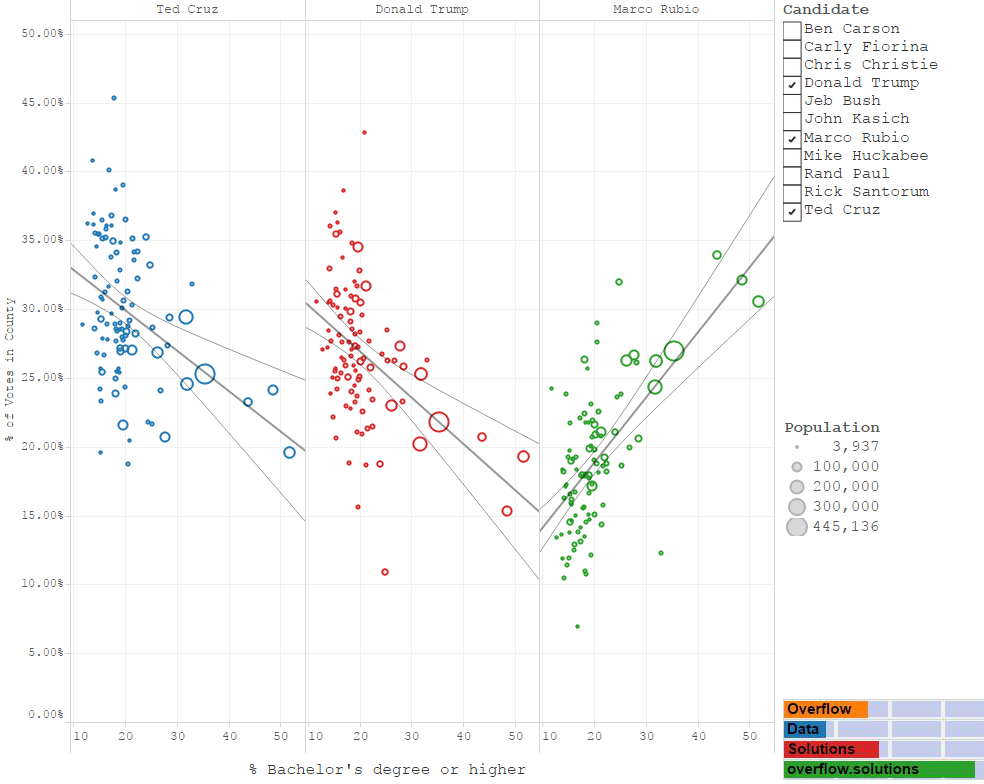
Does the % of a County’s Population with a Bachelor’s Degree Influence Candidate Performance?
Regression Statistics
[columns]
[column size=”1/3″]Ted Cruz
Equation
% of Votes in County =(-.0029)*(% with Bachelor’s degree)+.358
R-Squared=.1425
P-Value=.0001171[/column]
[column size=”1/3″]Donald Trump
Equation
% of Votes in County =(-.0033501)*(% with Bachelor’s degree)+.33633
R-Squared= .189179
P-Value<.0001
[/column]
[column size=”1/3″]Marco Rubio
Equation
% of Votes in County =(.00473508)*(% with Bachelor’s degree)+.0934412
R-Squared=.376102
P-Value<.0001[/column]
[/columns]
Quick Analysis
From this, it appears that this has a moderate correlation with all the candidates. Rubio seems to have the strongest correlation, with an upward trend meaning that the more people with a bachelor’s degree in a county, the better he will do. Trump and Cruz seem to have the opposite trend.
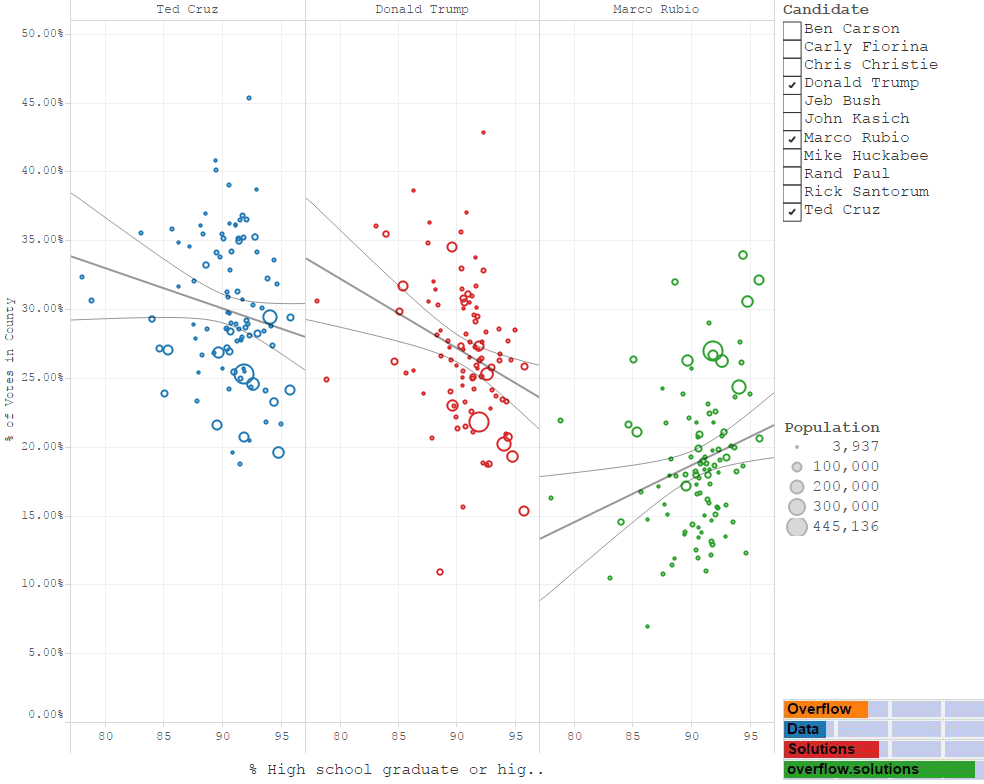
Does the % of a County’s Population with a High School Diploma Influence Candidate Performance?
Regression Statistics
[columns]
[column size=”1/3″]Ted Cruz
Equation
% of Votes in County =(-.00293)*(% with High school diploma)+.564
R-Squared=.030
P-Value=.0863[/column]
[column size=”1/3″]Donald Trump
Equation
% of Votes in County =(-.00505)*(% with High school diploma)+.7267
R-Squared= .0910
P-Value=.0024
[/column]
[column size=”1/3″]Marco Rubio
Equation
% of Votes in County =(.0041)*(% with High school diploma)+(-.1863)
R-Squared=.0608
P-Value=.0139[/column]
[/columns]
Quick Analysis
The percentage of people with a high school education doesn’t seem like a very good variable for analysis. This is most likely caused by the fact that most adults have a high school degree through out Iowa, and the country.
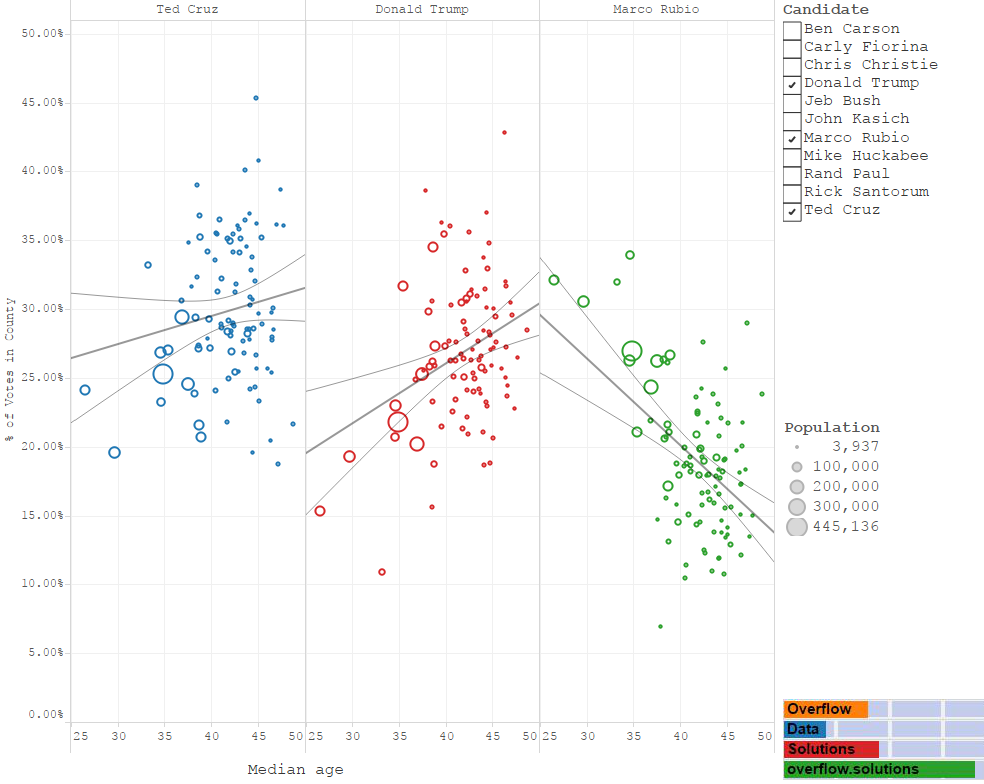
Does the Median Age of a County’s Population Influence Candidate Performance?
Regression Statistics
[columns]
[column size=”1/3″]Ted Cruz
Equation
% of Votes in County =(.0020)*(Median Age)+.2133
R-Squared=.0224
P-Value=.1396[/column]
[column size=”1/3″]Donald Trump
Equation
% of Votes in County =(.0043)*(Median Age)+.0868
R-Squared= .1033
P-Value= .0012
[/column]
[column size=”1/3″]Marco Rubio
Equation
% of Votes in County =(-.0063)*(Median Age)+.4539
R-Squared=.2177
P-Value<.0001[/column]
[/columns]
Quick Analysis
From this it seems that Marco Rubio does very well with younger voters. and there is a moderate relationship supporting that. Cruz and Trump seem to do better with older voters. The Cruz model is not statistically significant though.
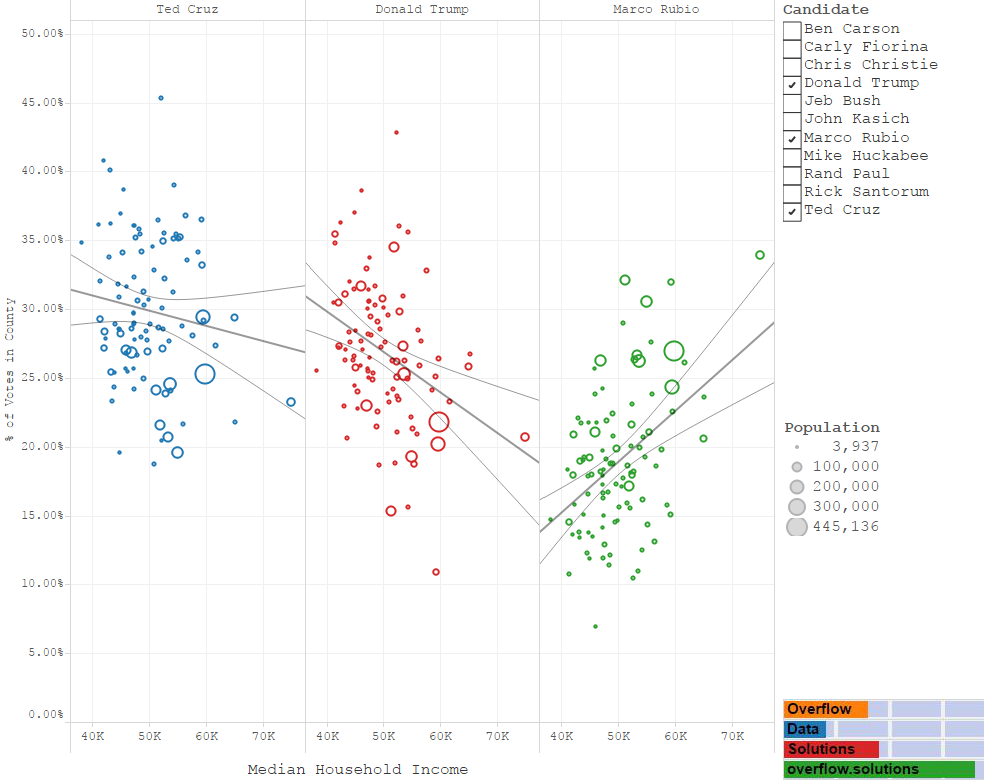
Does the Median Household Income of a County’s Population Influence Candidate Performance?
Regression Statistics
[columns]
[column size=”1/3″]Ted Cruz
Equation
% of Votes in County =(-.000001)*(Median Household Income)+.3542
R-Squared=.0164
P-Value=.2059[/column]
[column size=”1/3″]Donald Trump
Equation
% of Votes in County =(-.000003)*(Median Household Income)+.4159
R-Squared= .1186
P-Value=.0004
[/column]
[column size=”1/3″]Marco Rubio
Equation
% of Votes in County =.000004*(Median Household Income)+.0035
R-Squared=.1873
P-Value<.0001[/column]
[/columns]
Quick Analysis
Again, we have a nonsignificant model for Cruz, a weak, negative model for Trump, and a decent positive model for Rubio.
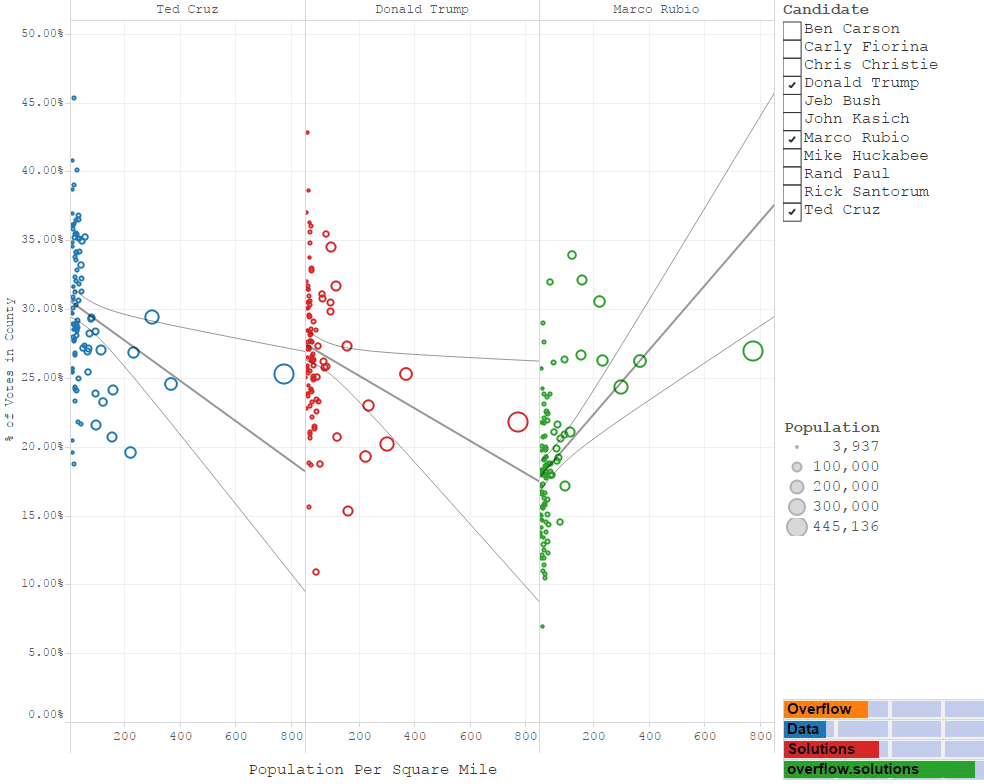
Does the Population Density of a County’s Population Influence Candidate Performance?
Regression Statistics
[columns]
[column size=”1/3″]Ted Cruz
Equation
% of Votes in County =(-.0001)*(Population Per Square Mile)+.3068
R-Squared=.0689
P-Value=.0087[/column]
[column size=”1/3″]Donald Trump
Equation
% of Votes in County =(-.0001)*(Population Per Square Mile)+.2753
R-Squared=.0456
P-Value<.0338
[/column]
[column size=”1/3″]Marco Rubio
Equation
% of Votes in County =.0002*(Population Per Square Mile)+.1761
R-Squared=.1790
P-Value<.0001[/column]
[/columns]
Quick Analysis
While they were both statistically significant and they both go in a negative direction, the regression analysis for Trump and Cruz isn’t a very good fit. The model for Rubio shows that more densily populated areas have a higher number of his supporters and is a decent fit.
Profiles
[columns]
[column size=”1/3″]Ted Cruz
Does better in counties with:
- Less College Educated People(Weak – Moderate Relationship)
[/column]
[column size=”1/3″]Donald Trump
Does better in counties with:
- Less College Educated People(Weak – Moderate Relationship)
- A higher median age (Weak Relationship)
- Smaller Median Incomes (Weak Relationship)
[/column]
[column size=”1/3″]Marco Rubio
Does better in counties with:
- Younger Median Age(Moderate Relationship)
- More College Educated People (Moderate – Strong Relationship)
- Higher Median Incomes (Weak- Moderate Relationship)
- Higher Population Densities (Weak- Moderate Relationship)
[/column]
[/columns]
Be sure to check out the interactive version of this model to see if you can find traits with the other candidates.
Final Thoughts
This analysis seems to confirm the fact that Trump and Cruz have similar supporter profiles. All of there trends seemed to match up even though they differed in the strength. All of these relationships had a weak or moderate correlation.
Marco Rubio on the other hand, has the opposite patterns with his supporters. His models also had stronger correlations. There are a number of factors that could be causing this such as campaign strategy and messaging. It may also be an establishment v. outsider divide. Further study of the patterns of the other candidates may provide more information.
To confirm these trends, it would be best to have individual voter files that would allow you to see if you could replicate these results. These counties have served as a nice proxy in the mean time, but the more granular individual level data would be the most accurate.
It will be interesting to see how this plays out through the primary and through the general election. The common perception is that Republican candidates either mortally wound each other with attacks or are too conservative to get elected. It would be interesting to see this investigated more though because it would appear from this, that Republican establishment, like Rubio, share a similar base with Democratic Party Candidates.
These young, educated voters, may support Republicans in primary elections, but in general elections, there are either more of these voters that vote for the Democratic candidates, or these voters are swayed to vote for another candidate. This theory is something that could be studied further if I create this analysis for the Democratic Caucus Results.
Source
The data for this visualization comes from the US Census Bureau and CNN’s Election Results for the 2016 Iowa Caucuses. The data from the Census was taken from American Fact Finder, and the data can be found at the following tables.
- Population-DP05 2010-2014 5 Year Estimates
- County Size(Sq. Miles)- G0001 2009 Estimates
- Median Income- S1903 2010-2014 5 Year Estimates
- Median Age- DP05 2010-2014 5 Year Estimates
- Educational Attainment- S1501 2010-2014 5 Year Estimates
The data was manipulated in excel. That file is available below. The visualizations were created in Tableau.
2016-Iowa-Republican-Caucus-Analysis File
If you want to keep up with our surveys and data analysis, be sure to follow us on Twitter and Facebook.
Up Next
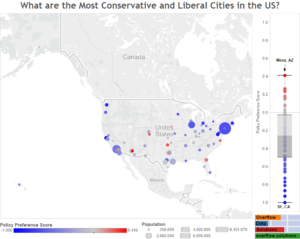
What are the Most Liberal and Conservative Cities In America?
Leave a Reply