Introduction
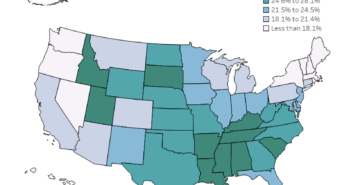
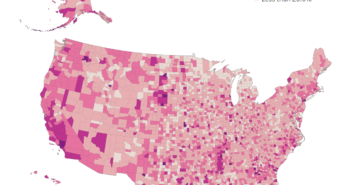
Renters in the United States spend on average 30.3% of their household income on rent. Since the size of household income and the cost of rent can differ by state we created the visualization below to show how the percentage of income spent on rent can differ by state.
Visualization
Mobile Users: If you are having issues using the interactive version of this visualization, you can find a static version of it here.
Data Notes
The data used in this visualization is compiled by the US Census Bureau which produces the American Community Survey. I used the 2015 one year estimates from table B25071 on American Fact Finder. To create this data, the US Census Bureau compared the rental cost of households and compared it to the income in these homes to calculate the median gross rent as a percentage of household income. I used Excel to clean this data and Tableau to create the visualization.
If you want to keep up with our surveys or data analysis be sure to follow us on Twitter and Facebook.


