
Mobile Users: If you are having issues using the interactive version of this visualization, you can find a static version of it here.
Data Notes
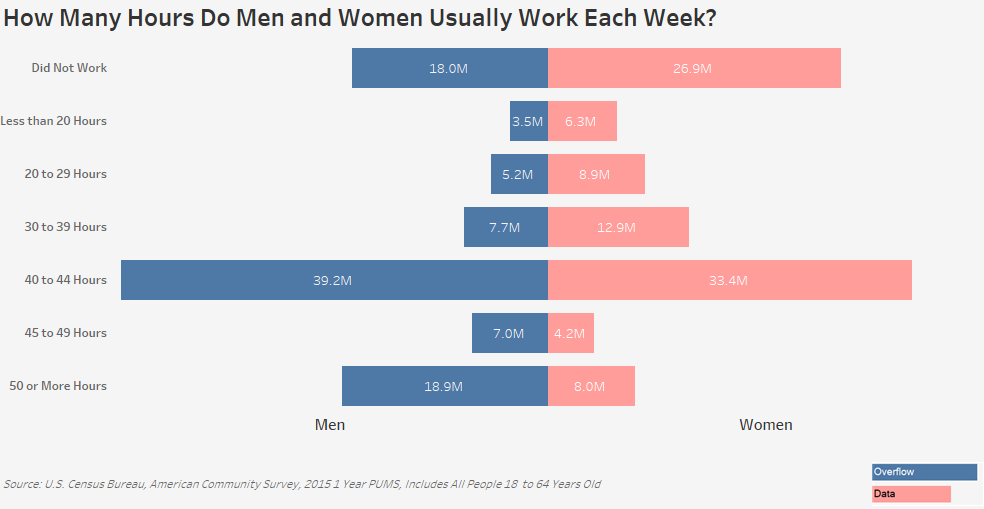
I wanted to create a visualization that showed how the hours that men work each week compares to the number of hours that woman work. To do this I used data published by the American Community Survey, a product of the US Census Bureau. I utilized the 2015 One Year Estimates Public Use Microdata Sample to create this visualization. The data can be found on the ACS Website. Once I had the data, I used Tableau to visualize the data. I grouped the “Usual hours worked per week past 12 months” variable into the groups I wanted, formatted it, and published the visualization on Tableau Public.
If you want to keep up with our surveys and data analysis, be sure to follow us on Twitter and Facebook.
How Many Hours Do Men and Women Usually Work Each Week? #dataviz https://t.co/hI7wDfovSM pic.twitter.com/KrY8Kpl94U
— Overflow Data (@overflow_data) March 9, 2017
Hello, after reading this awesome piece of writing i am too glad to share my know-how here with mates.