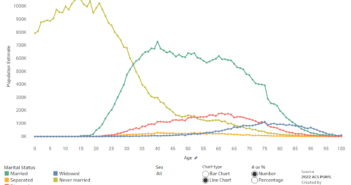
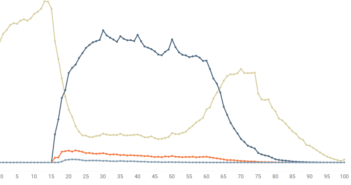
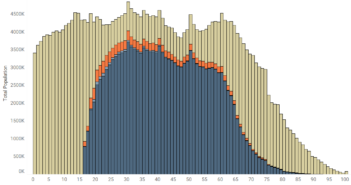
Visualization
Mobile Users: If you are having issues using the interactive version of this visualization, you can find a static version of it here.
Data Notes
I was interested in seeing how old the woman that gave birth in the last 12 month are so I made this visualization using American Community Survey Data. I used the 2015 One Year Estimates Public Use Microdata Sample, which can be found on the ACS Website. I then utilized Tableau to visualize the data. If you are interested in more data like this be sure to check out my “How American’s Differ by Age” Data Visualization.
Its worth mentioning that this is not representative of the woman that gave birth in the last 12 months from today, or even 2015. The question which is shown below asks this question. The answer is dependent on the month that the respondent answered the survey. The data shown above is representative of the responses gathered in 2015.
If you want to keep up with our surveys and data analysis, be sure to follow us on Twitter and Facebook.
How Old are the Woman that Have Given Birth in the Last 12 Months? #dataviz https://t.co/sqc4p5jCoM pic.twitter.com/4aDHiXHJEP
— Overflow Data (@overflow_data) December 29, 2016


2 Comments
Hmm.. 100% of divorced, unemployed 18 year old females gave birth.
Sounds like an issue with a small sample size