Over the last view years, October has always been my big run month. This year, I wanted to push it a little further and go more miles then I ever have in a month before. I wanted to put a plan in place and track my progress to stay motivated. I didn’t want to get to far behind and quit or compromise on my goal.
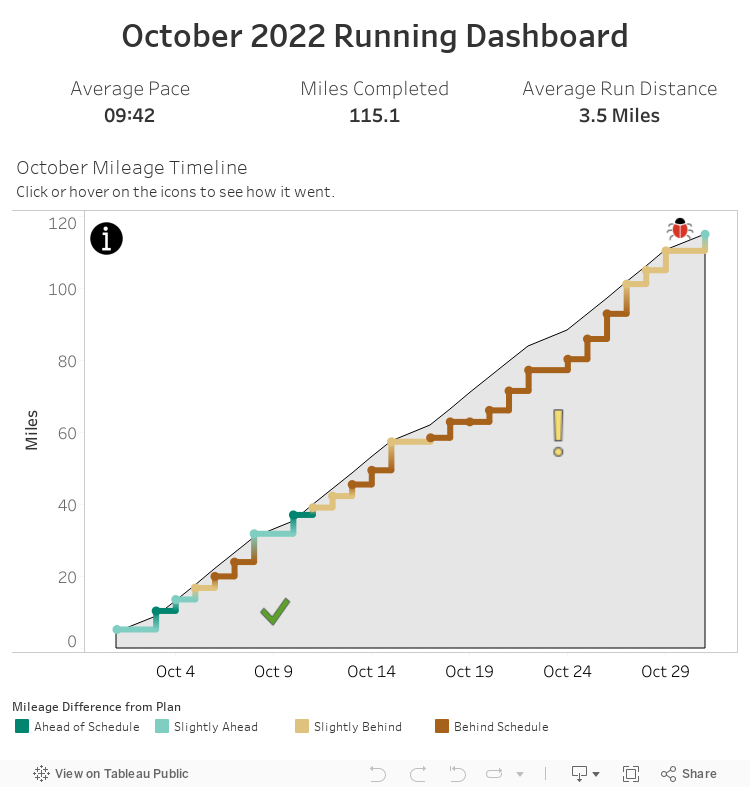
Here is how my month went and my progress to meeting my goal of 115 miles run in a single month.
Data Notes
To create this visualization, I used my Fitbit to track my runs. I then utilized the Fitbit API and some Python code to curate the data. Finally, I used Tableau Public to create and host the visualization. If you are interested in similar visualizations reach out to me or Overflow Data on Twitter.