Data Notes
The data for this visualization comes from the American Community Survey which is completed by the US Census Bureau. I used the 2014 One Year Estimates Public Use Microdata Sample which can be found on the ACS Website.
The visualization takes advantage of the numerous amounts of data collected by the ACS. You are able to filter the data by nine different demographic traits. Each side has a filter so you can compare the data to other groups and not just the population as a whole. Since the axis can change with each edit, a bubble has been provided that includes the total size of the filtered population. Below you are able to see a little more about these filters as well as images of the question from the ACS Form.
Sex
Pretty generic question here. You can select male or female.
![]()
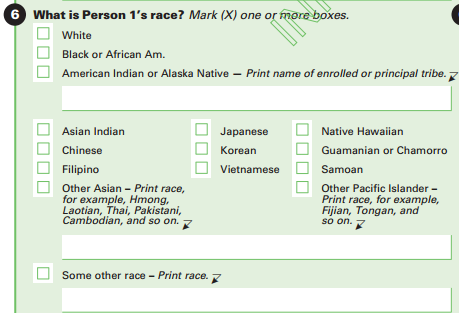
Race
The ACS has six basic race categories. You are able to choose between White, Black or African American, American Indian or Alaska Native, Asian, Pacific Islander or some other race.
Employment Status
This fields is broken out to let you see not only who is in the labor force and who isn’t, but it allows you to see age of those who are employed in the Armed Forces as well.
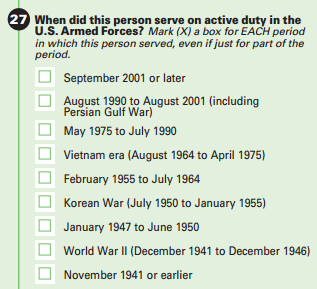
Veteran Period of Service
The age of veterans is often contingent on the era they fought in. This filter allows you to see the age distribution based on a veteran’s period of service.
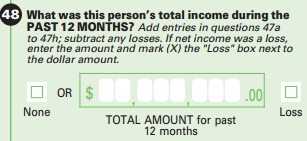
Income Ranges
Here you can look at the age of people based on their personal income. The ACS asks multiple questions about different income sources, but this filter focuses on the total.
It is worth noting that this is only a person level detail so some people may come from wealthy households, but make much money on their own.
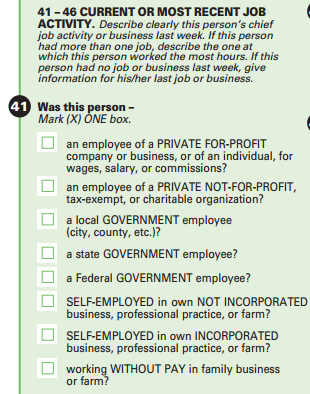
Class of Worker
This option allows you to see the age distribution of employees in different industries.
State
Geography often is associated with different trends. This allows you to look at the age distribution in different states.
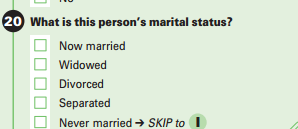
Marital Status
This allows you to see how old people based on their current marital status.
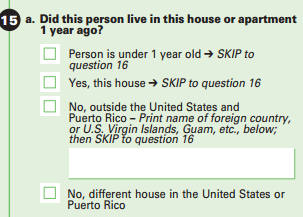
Mobility Status
Ever wonder what types of people are most likely to move? This shows you the age distribution for people that lived in the same home, moved within the US, and those that moved from another nation.
Be sure to share your most interesting comparisons in the comment section and we will be sure to post interesting ones our site.