
Introduction
Looking for an advantage in your fantasy league this year? Check out our Fantasy Football Draft Dashboard, equipped with everything you need to make a good pick. We have an explanation of every graphic below.
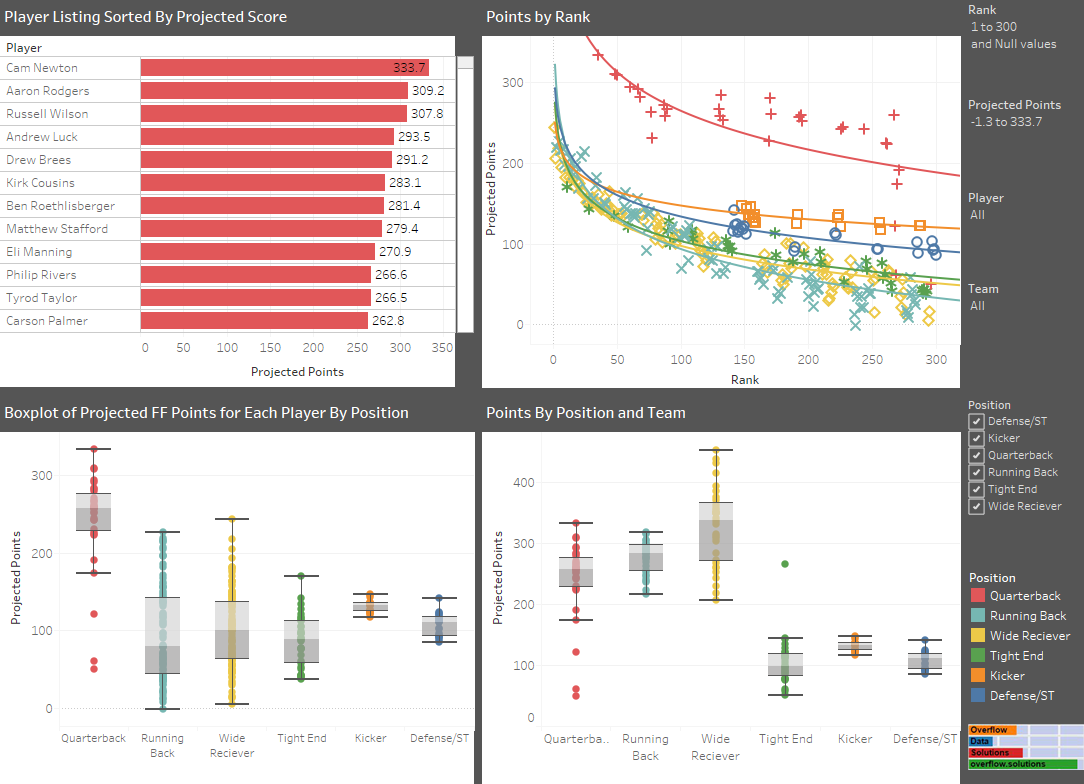
2016 Fantasy Football Dashboard
Note to Mobile Data Users: If visualization is too compressed to enjoy with the vertical view, switch to the horizontal view. The visualization will adjust automatically. If you would like to view a static version of the visualization you can find it here.
Available Filters
You can sort all the data in the dashboard by team, position, projected points rank, projected points, and name.
Player Listing
We have all the players listed by the number of points they are projected to score this year. They are also color coded by position so you can differentiate between them.
Points by Rank
This scatter plot was featured earlier in the week and helped to show how many points you should be attempting to get with each draft pick. Since then it has been updated and each position has its own logarithmic tread line. While it might be tough to take it all in at once. Filter by position to see how many points you need a player to have so it its a successful draft pick.
Box-plots
We all know that while all know that quarterbacks are going to score the most points, the scarcity of good players at other positions makes them more valuable. With the box plots you can tell just how valuable a player is when compared with his peers and where just anyone will do when trying to fill the last few spots on your team.
Points by Position and Team
Getting down to the end you are probably getting more concerned with having a good player to fill a bye than who it will be. Use this scatter plot to see what teams have the players expected to score the most points at each position after filtering out the teams on a bye.
Additional Tips
While drafting I have had two of these dashboards available. One that I am leaving static, and another that I am updating as I go by clicking on the players name and exclude. This lets me see what the overall view is and how the draft is progressing.
Also, If you want to have larger graphics, download the workbook and Tableau Public. This will help maximize your size of the graphics and make any adjustments you think you need. This will give you faster load time and let you make your own cool visualizations in the future.
Source
The data was copy and pasted from ESPN’s Fantasy Football Projections, cleaned in Excel, and the visualization was created in Tableau. If you want to download the Tableau workbook you can do so by clicking the download portion of the visualization. If you want to download the Excel Workbook you can find it here.
Leave a Reply