[accordions]
[accordion title=”A Note for Mobile Users” load=”hide”]You have been automatically directed to this page because we detected you were using a mobile device. How to integrate mobile users in the visualization realm continues to be an issue for users and creators. At this current time we are only publishing desktop ready versions of our graphics. What you are currently seeing is a static version of the visualization. We hope that you use the sharing features below to facebook, tweet, or email yourself the link so you can enjoy the visualization and its interactivity later on.[/accordion]
[/accordions]
Introduction
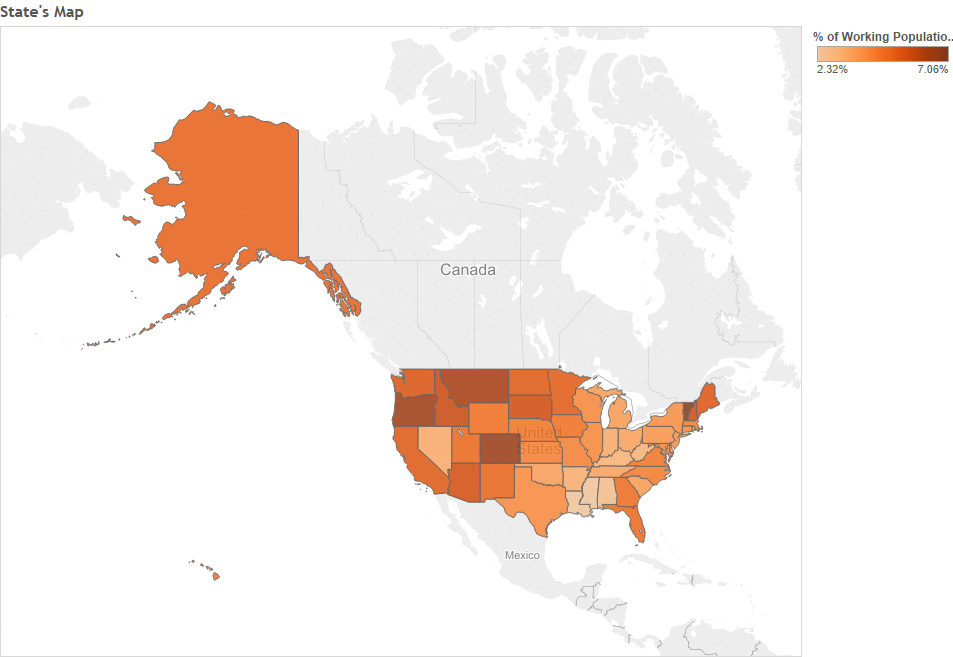
Of the 139,786,639 working individuals in the US, 6,046,385 or about 4.33% of that population work at home according to the 2013 American Communities Survey. The graphic below, breaks that out by state and county to show you where people call the office, home. From what we can see, the counties with the largest proportion of these workers are small rural counties, but when you also look at some of the larger urban counties you can see some uptick in the outlying areas as well.
Quick Facts
State with Highest Percentage: Vermont, 7.06%
State with Lowest Percentage: Mississippi, 2.32%
County with Highest Percentage: Jackson County, South Dakota: 23.01%
County with Lowest Percentage: Kennedy County, Texas; o%
County with Workforce of More than 50,000 People with Highest Percentage: Boulder County, Colorado; 11.24%
County with Workforce of More than 50,000 People with Lowest Percentage: Cumberland County, New Jersey; 1.33%
Source
The information displayed above comes from the American Communities Survey, 2013 5 Year Estimates which is published by the US Census Bureau. These figures can be found on Table B08101 at http://factfinder.census.gov/.
