Introduction
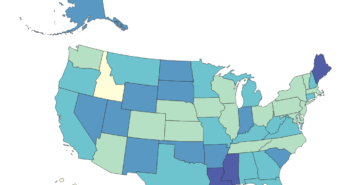
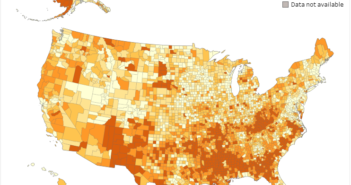
It is a well known fact that the price of different goods vary from state to state. What we don’t see very often though is a standardization of raw statistics to reflect this. Below you are able to find the nominal median income of each state, or the raw number, and the real value of the median income in each place, or the purchasing power.
[accordions]
[accordion title=”A Note for Mobile Users” load=”hide”]How to integrate mobile users in the visualization realm continues to be an issue for users and creators. At this current time we are only publishing desktop ready versions of our graphics. That doesn’t mean we don’t want you to see them. We just hope that you use the sharing features below to facebook, tweet, or email yourself the link so you can enjoy the visualization later.[/accordion]
[/accordions]
Source
The data for this visualization comes from the 2013 ACS 5 Year Estimates for Median Income and BEAs Regional Price Parities. The data was manipulated in excel and then loaded into Tableau to create the visualizations.
The ACS Data can be found at http://factfinder.census.gov/ The BEA data comes from https://www.bea.gov/newsreleases/regional/rpp/rpp_newsrelease.htm


