Introduction
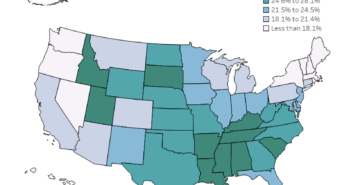
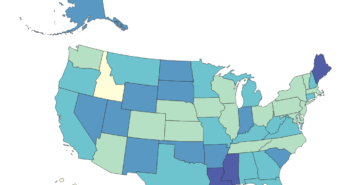
I was recently reviewing what percentage of Americans have Internet access and thought it would be cool to see the differences in how people access the internet in each state. Below, is a visualization on how households access the internet in each state, according to the American Community Survey.
Visualization
Data Notes
The data for this visualization comes from the United States Census Bureau. It is gathered during the American Community Survey. I used 2014, 1 Year Estimates for each of the states. This can be found at American Fact Finder under Table B28002.
I utilized Excel and Tableau to create this visualization.
The “Other and Multiple Types” Internet Access category includes all households that reported multiple types of “fixed internet access”, only had a mobile internet connection, and those that reported having some other type of internet connection.


1 Comment
Generally denser cities are more liberal, but a deeper exploration would be necessary before assigning density as the cause.