Introduction
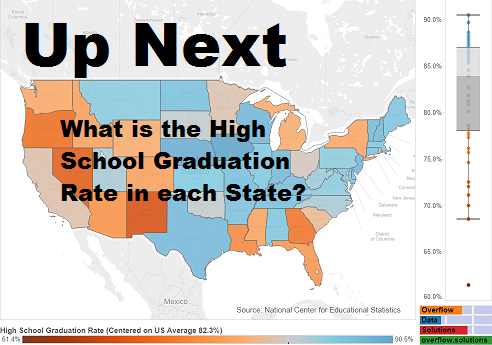
Earlier this week, I published some graphics about the high school graduation rate in every state. After having a conversation about the data, I thought it would be cool to compare these rates with the average SAT score from each state. From this I could attempt to determine if some states high graduation rate were based on low standards. As I started to complete the project, I realized, there was a big issue with my data I hadn’t anticipated.
Initial Analysis
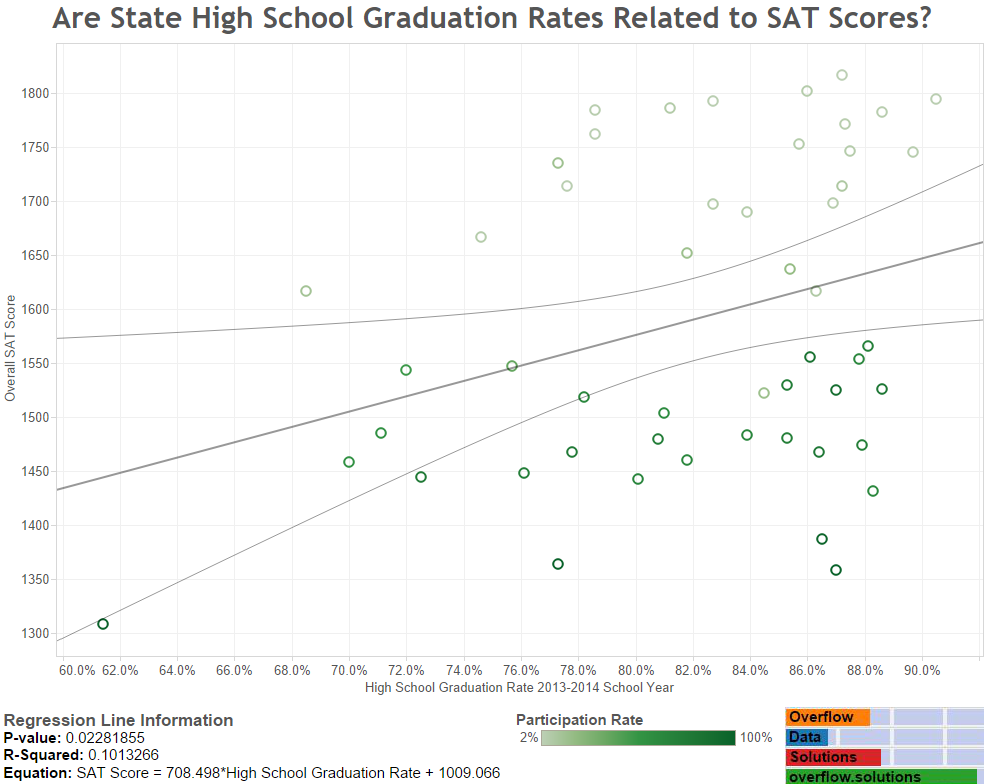
At first, everything seemed to be going okay. I had set up my regression analysis, the fit wasn’t great, but it was statistically significant. I set out to pretty it up a bit before I did any more to it. It was just by chance that I grabbed a variable labeled, “Participation” and applied it as the color scheme. At that point I immediately discovered something wasn’t right with my analysis. As you can see, a distinct pattern appears between low participation states, light green, and high participation states, dark green. I decided I should go to the source and figure out what this variable means.
Research
As you would probably guess, the participation rate is the number college bound seniors that take the SAT as compared with an estimate of the all graduating high school students in that year. A little more research and I found a College Board publication that specifically states that comparisons between states should not be performed because of the varying participation rate. This is because the participation rate causes there to be variations in the mean score for each state.
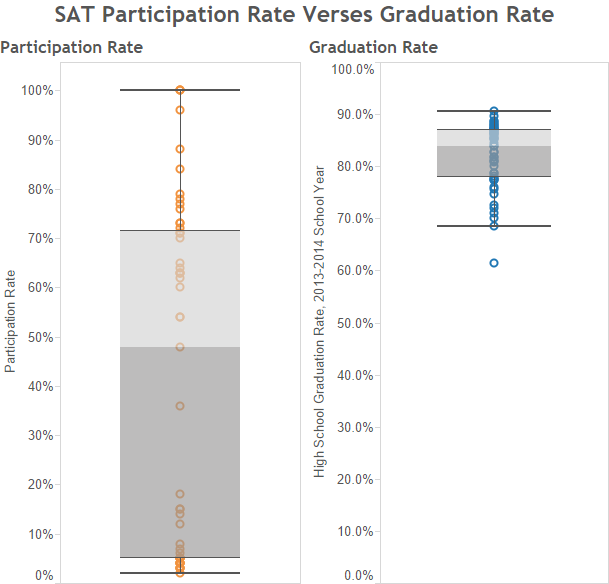
I discovered that on of the biggest reasons for the differences in participation rate are state mandates. The states with the lowest scores; Idaho, Delaware, and Washington D.C. all require students to take the SAT. Some of the states with extremely low SAT participation rates, require all students to take the ACT. Below you can see how wide the participation rate is compared with the graduation rate.
New Analysis
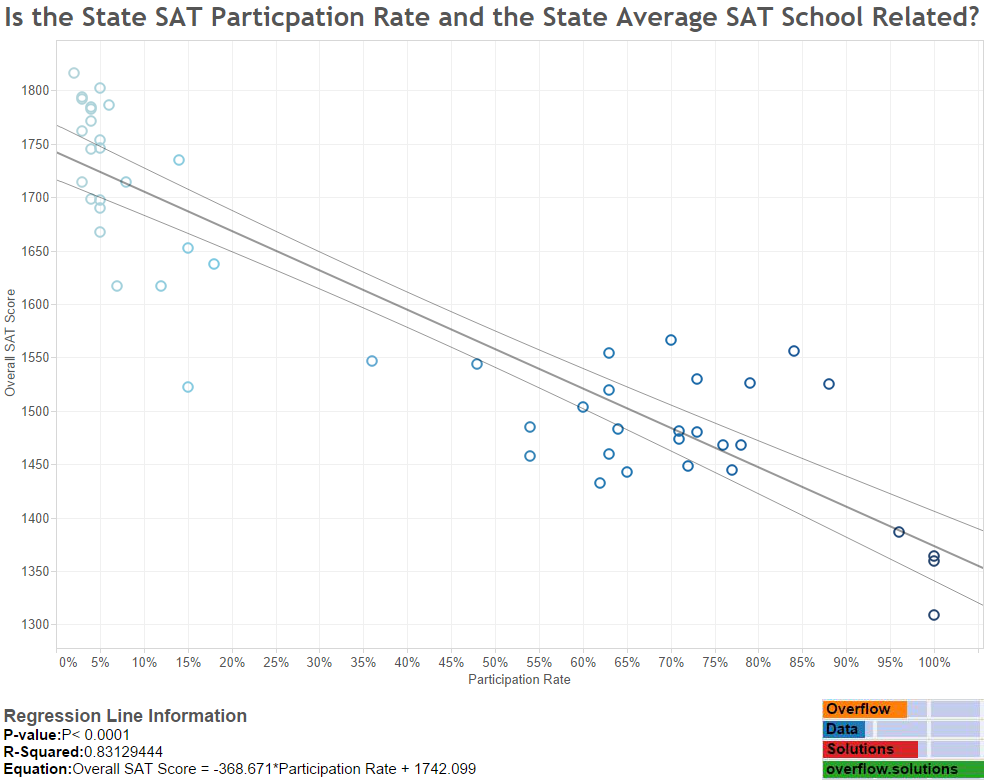
After, I had figured all this out, I decided I wanted to run another regression analysis. I was curious if the participation rate, had a direct effect on the average test score for each state. My logic, which I borrowed from my source, is that students in low participation states only have the brightest and most prepared students ready to take the SAT. In high participation states thought, you get a little bit of everything. As you can see below, this is a much more sound theory.
Takeaways
I had two main takeaways from this experience:
Know Your Data!
If I would have taken just a few more minutes to study my data I wouldn’t have made such a bad mistake with my initial analysis. If I wouldn’t have accidentally stumbled upon the participation coloring in the first graphic, I would have probably published an analysis that was inherently flawed.
Statistically Significant Doesn’t Mean Your Analysis is Good, Especially with Regression!
The first thing that started to tip me off, but should have been more of a sign was that the p value wasn’t that low and the r squared value wasn’t very high. I should have paid more attention to the r squared value since a value of .10 is very low. Technically though, the results could be viewed as significant. This example can be thrown in a heap of evidence about why good research, logic, and theory, is better than statistically significant results.
Data Notes/Sources
The data for this visualization involves the 2013-2014 high school graduation rate which was provided by the National Center for Educational Statistics. The 2014 SAT average score by state is published, by the College Board. I used a compilation created by Prep Scholar, but reviewed a few data points to ensure accuracy. Once the data was moved into excel, it was loaded into Tableau where I created the visualizations and ran the analysis.