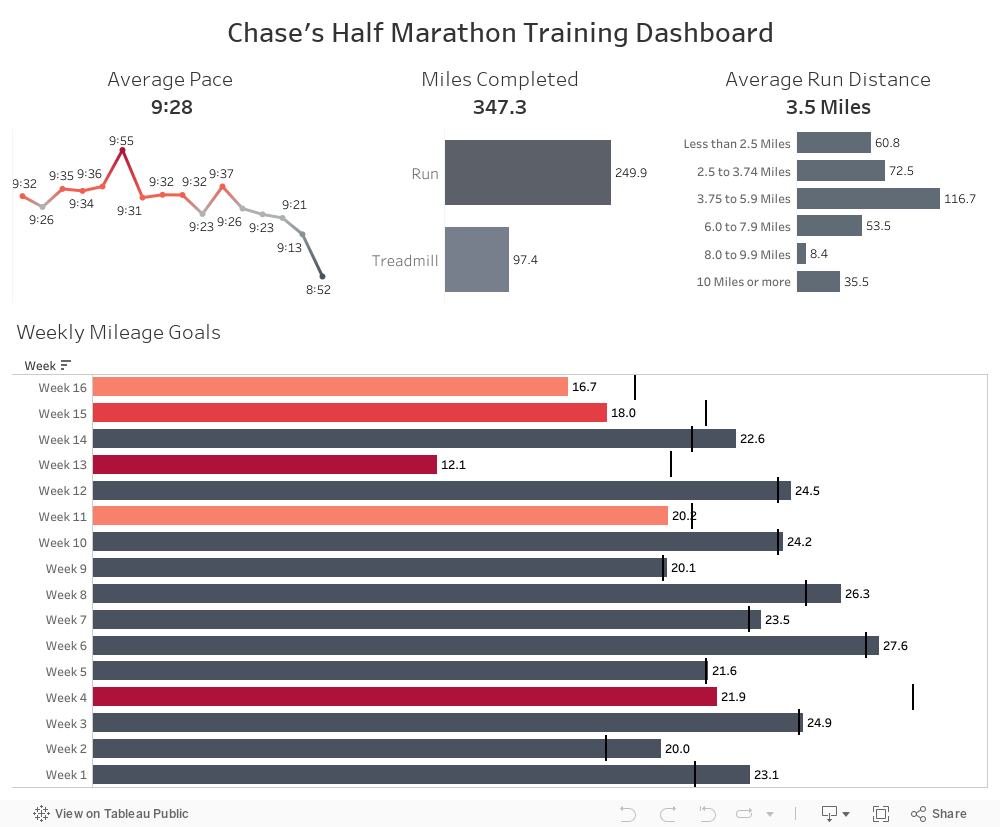
Recently, I have been training to run a half marathon. To help me keep track of my progress and training schedule, I created this visualization. It shows my pace each week, whether I am using a treadmill or running outside, the length of my runs, and if I am hitting my weekly goals. You can check it out below.
Data Notes
To create this visualization, I used my Fitbit to track my runs. I then utilized the Fitbit API and some Python code to curate the data. Finally, I used Tableau Public to create and host the visualization. If you are interested in similar visualizations reach out to me or Overflow Data on Twitter. You can also email overflowdatasolutions@gmail.com about a data consultation about any type of data.