Introduction
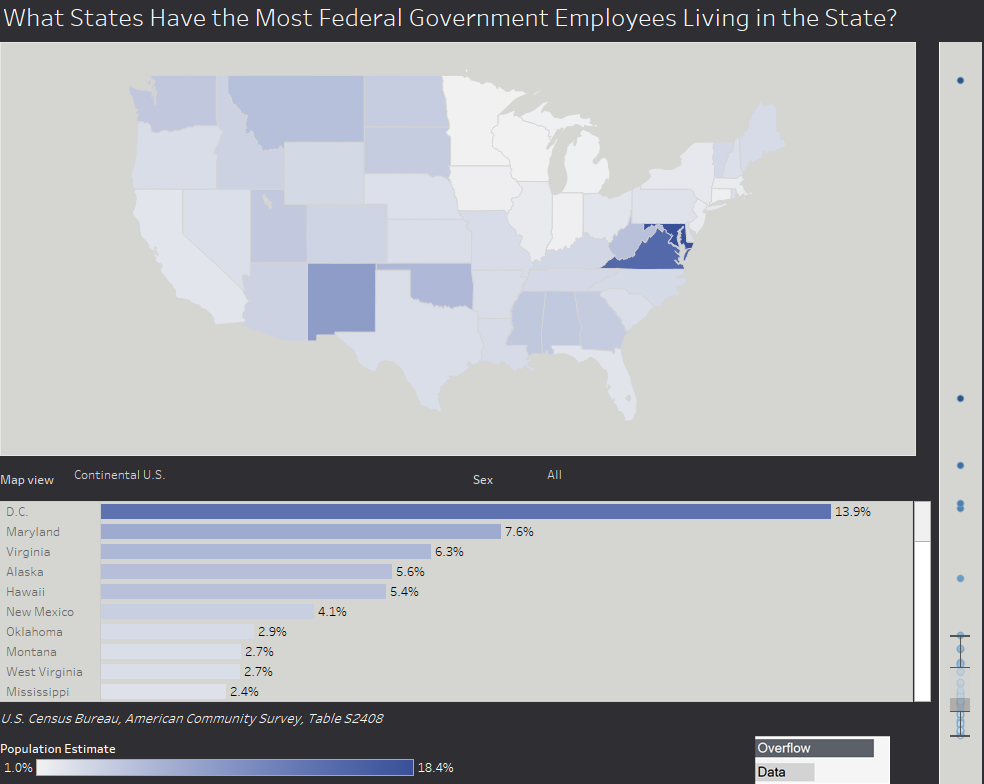
According to the American Community Survey, 3,682,264 workers or 2.4% of Americans, are employed by the federal government. Like any demographic trait though the results can vary a great deal by region and state. The visualization below shows what states have the highest proportion of the population that are federal workers.
Visualization
Mobile Users: If you are having issues using the interactive version of this visualization, you can find a static version of it here.
Data Notes
The data used in this visualization is compiled by the US Census Bureau which produces the American Community Survey. I used the 2015,One Year Estimates from Table S2408, which can be found at American FactFinder. I used Excel to clean the data and Tableau to create the visualization. It is worth pointing out that the graphic shows where the workers live and not where they work.
If you want to keep up with our surveys and data analysis, be sure to follow us on Twitter and Facebook.
What States Have the Most Federal Government Employees Living in the State? #dataviz https://t.co/EvkH3VOibv
— Overflow Data (@overflow_data) February 23, 2017