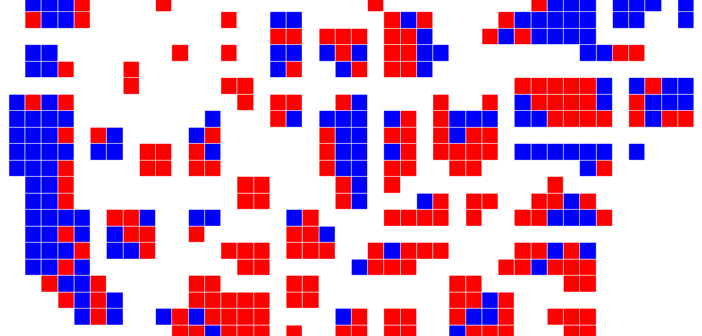
Tableau Congressional District Cartogram
This post provides a Tableau cartogram of congressional districts. Feel free to use and share.
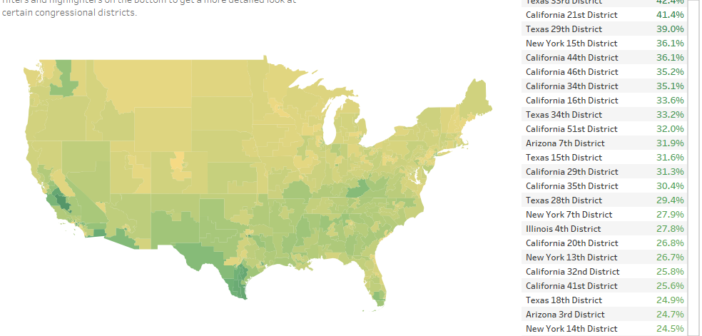
Our gallery view at how educational attainment varies in different congressional districts.
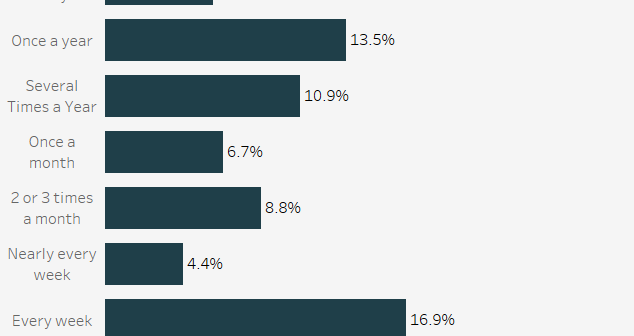
A look at how often Americans reported going to church in 2016.
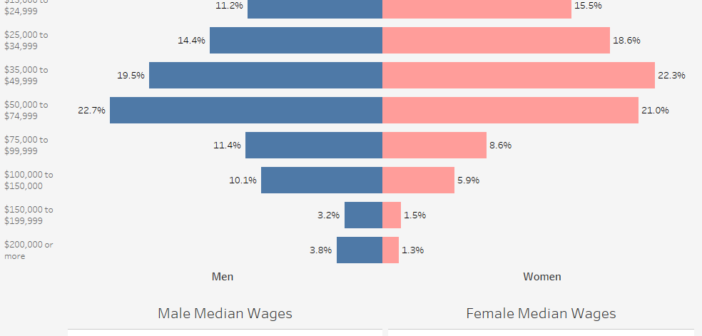
Our interactive tool lets you take a look at the wage gap and how it differs in different circumstances.
A look at where is expensive and inexpensive to buy a home in the US.
Loading… Mobile Users: If you are having issues using the interactive version of this visualization,…
See the Pen Generate 50 State Images with Tableau and JQuery by R Chase Sawyer…
Regression Statistics forĀ “Did the % of Party Affiliation by County in California Have an Effect…
Data Notes The data from this visualization comes from the words in Martin Luther King…
Issues in the financial and housing market were in the center of our most recent economic crisis. Here is a look at how it has effected home ownership.