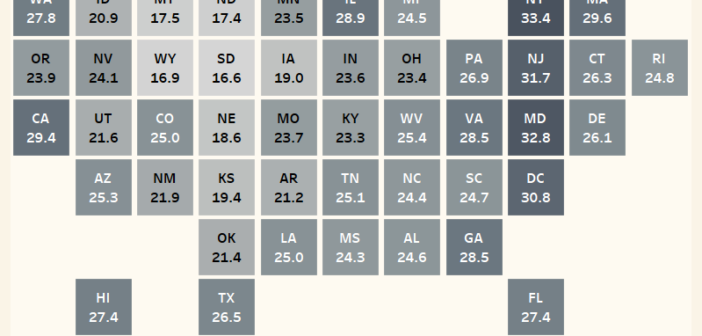
Use our tile maps to get an idea on how certain demographic traits vary by state.
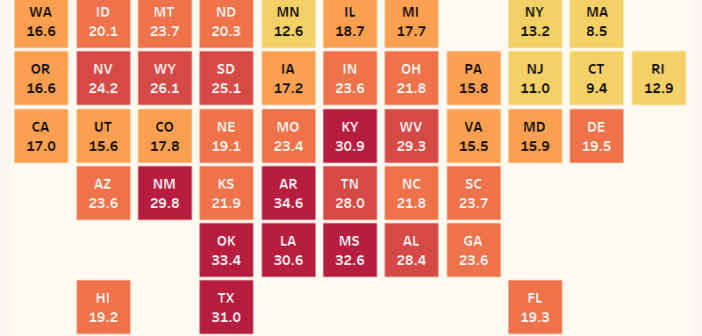
What states have the highest rates of teens giving birth?
A look at how the number of teen pregnancies that lead to a birth differs in each state.
Use our tile maps to get an idea on how certain demographic traits vary by state.
A look at how the number of teen pregnancies that lead to a birth differs in each state.
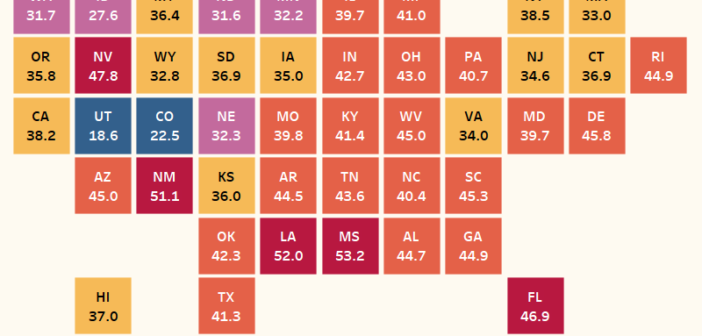
A look at how the percentage of birth to unmarried mothers can differ in each state using a tile map.
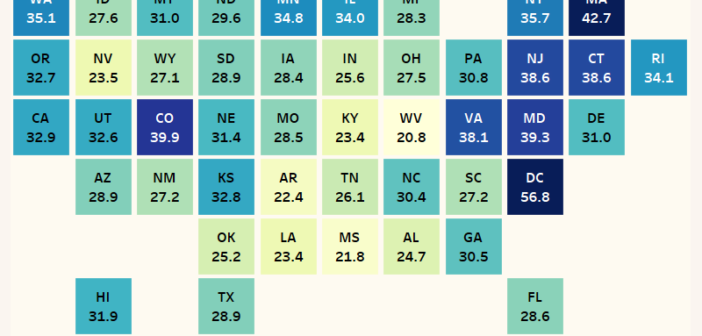
A tile map showing what states have the most people with a bachelor’s degree.
A look at what state’s workers spend the most time commuting to work.
A look at how the average cost of rent differs in all 50 states and the District of Columbia.
A graphical look at what percentage of owner-occupied homes are worth more than a million dollars in each state.
This data tool lets you look at tile maps for 15 demographic and socioeconomic traits.
A look at what percentage of households are occupied by someone living alone.
A look at what percentage of the population is obese in each state.
A look at how many households in each state own a computer.