Which Congressional Districts Have The Most People Without Health Insurance?
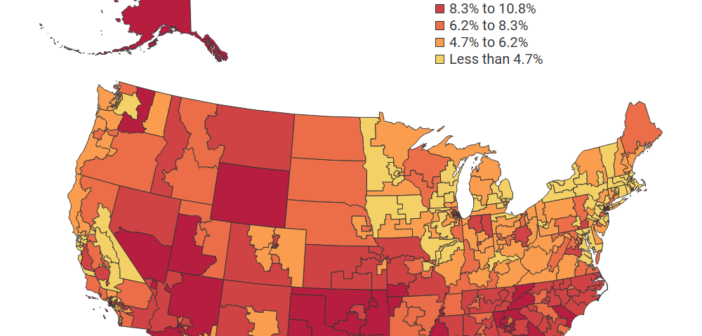
Explore data on uninsured populations across the US by congressional district. Inform your decisions for impactful interventions.

Explore data on uninsured populations across the US by congressional district. Inform your decisions for impactful interventions.

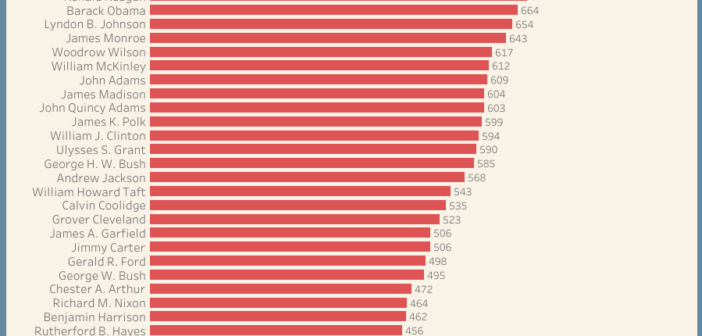
Discover historians’ grades for past presidents on President’s Day. Explore compelling data visualizations of their performance assessments.

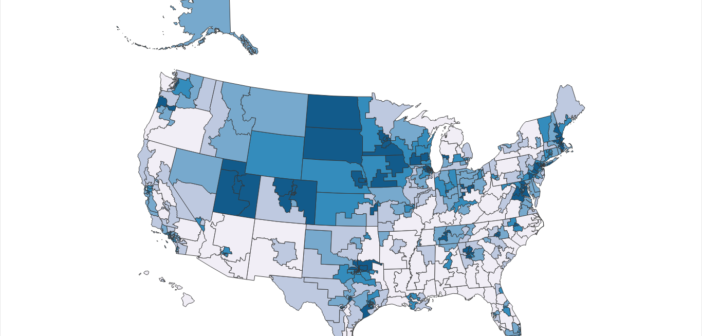
Understand how employment is different in each congressional district by using this data visualization.

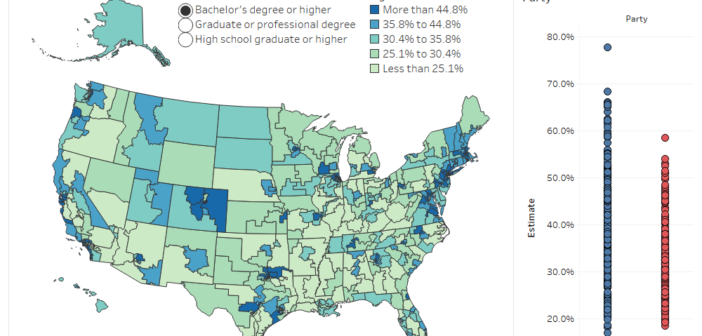
This data viz examines information to show different levels of educational attainment for people living in each district.