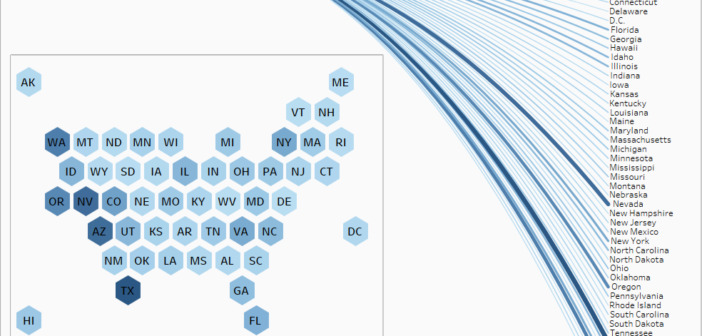
When People Move Out of State, What States Do They Move To? (Mobile)
This data visualization allows mobile users to see where people are moving.
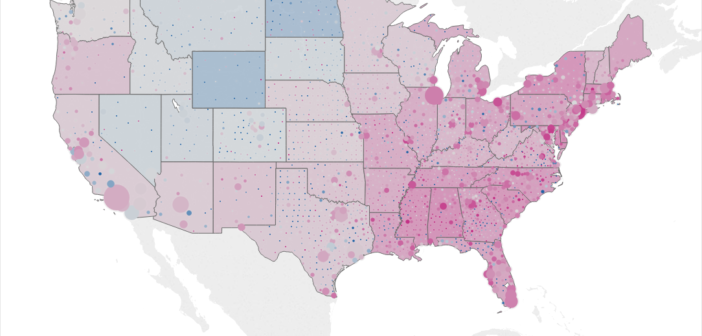
This shows how the ratio of males to females differs in each county and state. It includes filters to look at individual states and age groups.
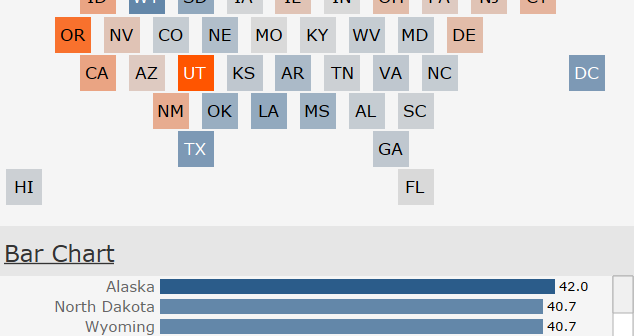
The average American worker spent 38.7 hours per week at work. Here is a look at how it differs by state.
A visualization exploring the educational enrollment of Americans for mobile devices.
A look at the number of businesses in the United States that classify themselves as an Arts, Entertainment, or Recreation establishments and how many there are per capita.
This visualization shows the overall, violent, and property crime rate in every state.
Visualization Loading… Note to Mobile Data Users: If you are having issues with viewing the visualization…
Introduction For another project I am working on, I am using crime statistics as a…
Introduction Happy Independence Day! As a tribute to America’s birthday I decided to take a…
Utah had the largest families in the US with 3.65 people per family in 2014. This graphic shows the average family size for every state US.