The Age of Americans Married in the Past 12 Months
The ACS estimates that about 1.7% of people, 15 and older, were got married in the last 12 months. This visualization shows how to this was distributed by age.
According to the Census Bureau, 33.5% of Americans have never married. This visualization shows how this percentage differs by state.
According to the Census Bureau, 11% of Americans are divorced. This visualization shows how this percentage differs by state.
Renters in the US spend on average 30.3% of their household income on rent. Since this can differ by state we created this visualization to show the percentage by state.
According to the Census Bureau, 47.5% of Americans are married. The visualization how this differs by state.
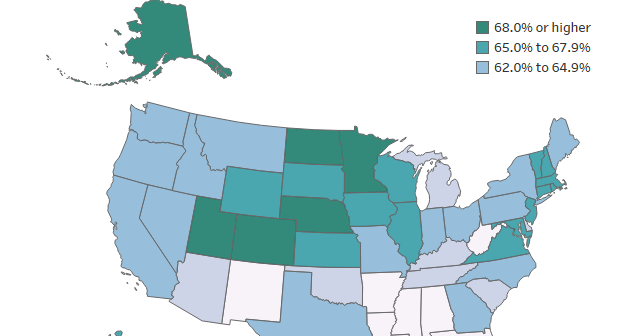
The average American worker spent 38.7 hours per week at work. Here is a look at how it differs by state.
A quick look at the changes and trends in the total amount of housing costs in America.
Housing costs have risen 19.4% since 2005 nationwide. Like most trends though, the data is different in every state. This visualization lets you see all the state trends in one spot.
This visualization looks at what the data is saying about how many people are getting married. While the trend away from marriage is apparent, it looks like more people are starting to get married again.
A quick look at how income is changing by state in the US.