How Old Are Recent Newlyweds?
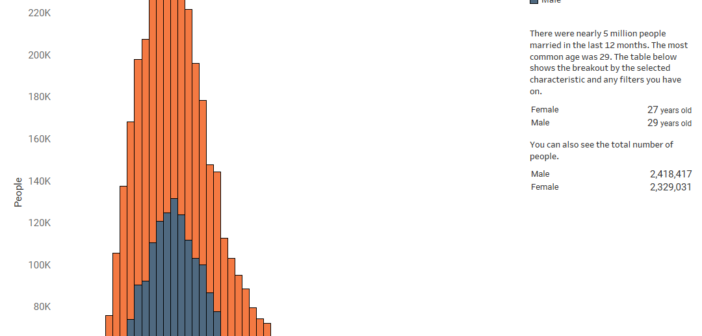
Nearly 5 million people got married in 2022. This data visualization looks at how old each of those people are.

Nearly 5 million people got married in 2022. This data visualization looks at how old each of those people are.

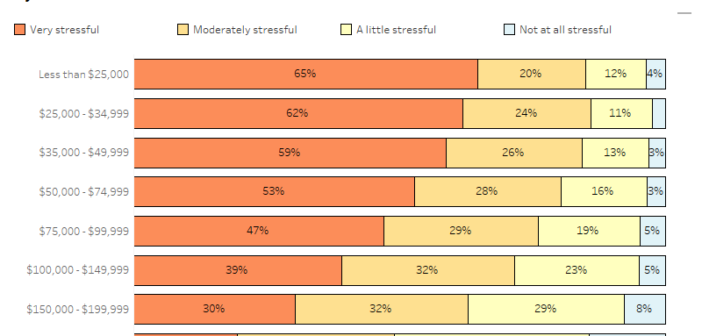
Recently, Americans have been shocked by price inflation. This visualization explores how stressful this has been for Americans.

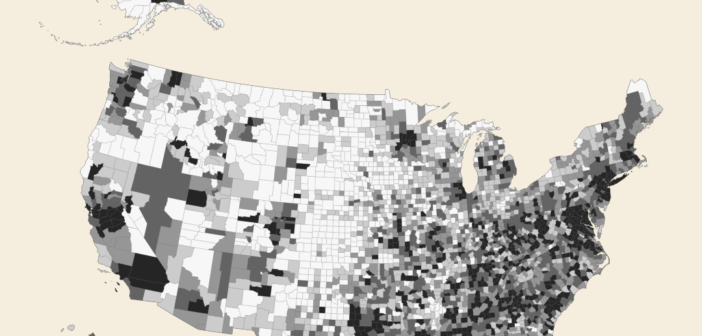
Commute times can differ throughout the nation for many reasons. This data visualizations shows the places with the longest commute times.

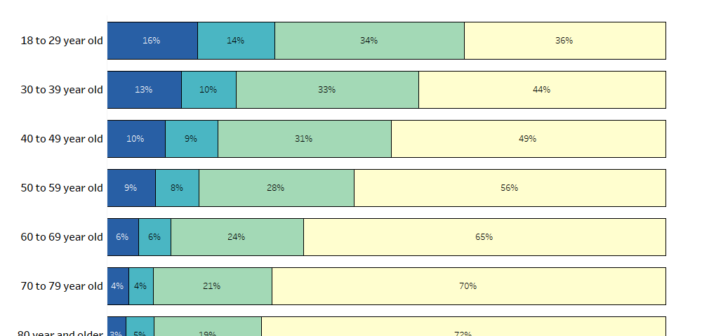
Exploring depression prevalence through Census data, this visualization unveils age-related reporting trends. The aim is to inform public health initiatives and promotes empathy.