What Percentage of Americans Have High Speed Internet?
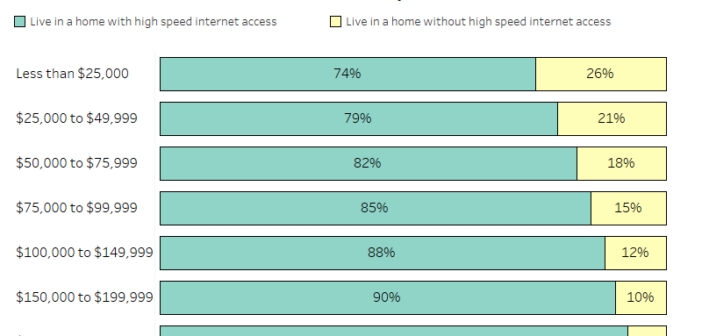
Explore high speed internet access in the US with our data visualization. Discover disparities based on income, age, education, and more.

Explore high speed internet access in the US with our data visualization. Discover disparities based on income, age, education, and more.

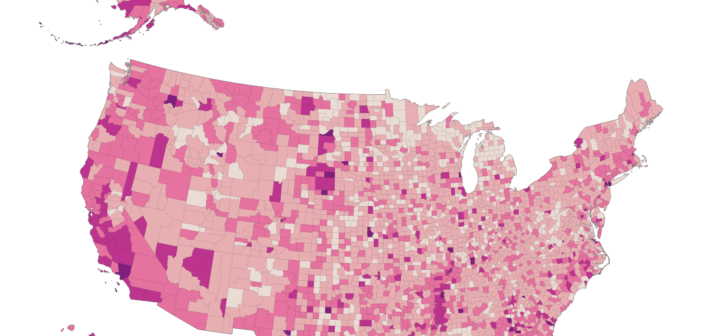
Get look at the local real estate landscape in the US. This tool explores the percentage of households that are rented in every county.

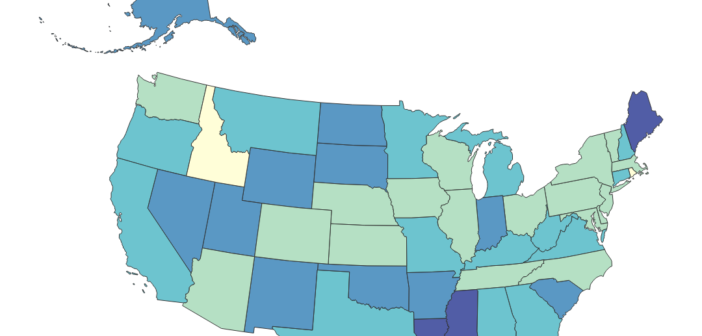
A recent survey found that 13% of adults said they were lonely. This state-level analysis sheds light on the emotional landscape of America.

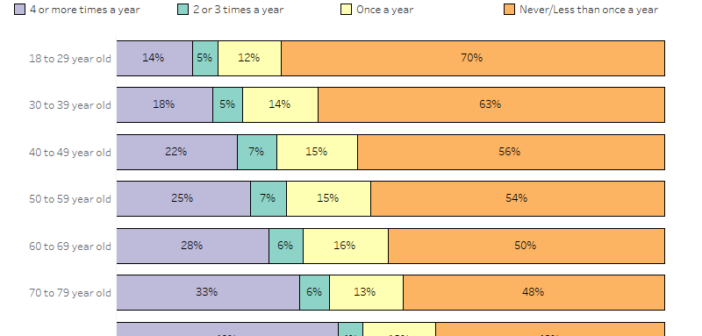
Explore how church attendance in the United States can differ by various social, economic, and demographic characteristics.