Introduction
I have always been a sucker for a good tile map. I know there some that are vehemently disgusted by them, but there is something I find nice about everything being equal in size. I have made visualizations with state tile maps using the methodology described by Matt Chambers in Tableau. I think I have found another type of geography that benefits from the practice.
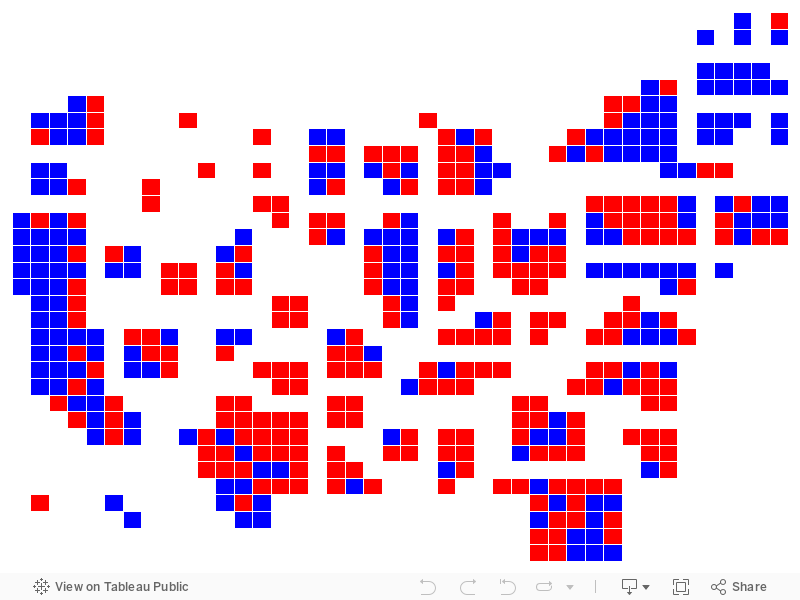
In this years coverage of the 2018 midterms, I noticed a lot of groups using cartograms or tile maps to show congressional districts. I think this is a perfect type of geography to have such a map because of the way that geographic size disparities can be an issue when showing political party preferences. I have included a visualization below that I created to allow people to download a version of this for Tableau. I have also included a link to the Google Sheet that has the points. The map is a little off because it shows the party representation for the 115th Congress, but I hope to update it when the vote counts are finalized.
Visualization
Data Notes
If you download that book you will see that I prefer the highlight table, because it adjusts for mobile. If you want you can easily switch it though to another chart type. Also, if you would rather access the spreadsheet on Google Sheets.
If you want to keep up with our surveys and data analysis, be sure to follow us on Twitter and Facebook.
Tableau Congressional District Cartogram @tableau #dataviz https://t.co/wio1ynTLuR pic.twitter.com/uamrlVmnp8
— Overflow Data (@overflow_data) November 17, 2018