Introduction
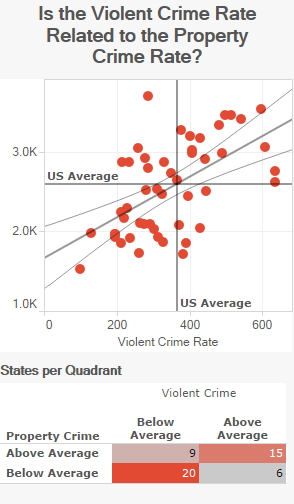
For another project I am working on, I am using crime statistics as a variable. I was curious if I should use the violent crime rate or the property crime rate for my analysis, so I decided to see if their was a relationship between them. The graphic below shows the linear relationship between the violent crime rate and property crime rate.
Visualization
Note to Mobile Data Users: If you are having issues with viewing the visualization you can try rotating the screen or you can view the static image here.
Regression Statistics
Property Crime Rate=2.55658 (Violent Crime Rate)+1665.28
R2=.327213 P-Value<.0001
Discussion
As you can see, there is a fairly strong linear relationship between the property crime rate and the violent crime rate. If one is high the other is as well and vice versa. What is most interesting to me is the states that seem to break this trend. There are a few states where one crime rate is high and the other is not. These states would be the most interesting to study and determine why this is occurring in my opinion.
Data Notes
The data for this visualization comes from the FBI – Unified Crime Report and shows the violent and property crime rates for every state per 100,000 people.
After the data was acquired, it was cleaned in Excel. The visualization was then created in Tableau. The data used can be downloaded from the Tableau interface.
If you want to keep up with our surveys and data analysis, be sure to follow us on Twitter and Facebook.