Introduction
[accordions]
[accordion title=”A Note for Mobile Users” load=”hide”]You have been automatically directed to this page because we detected you were using a mobile device. How to integrate mobile users in the visualization realm continues to be an issue for users and creators. At this current time we are only publishing desktop ready versions of our graphics. What you are currently seeing is a static version of the visualization. We hope that you use the sharing features below to facebook, tweet, or email yourself the link so you can enjoy the visualization and its interactivity later on.[/accordion]
[/accordions]
The average American worker works 38.4 hours per week according to the 2013 American Communities Survey published by the US Census Bureau. The graphic below, breaks that out by state and county to show you where people are working the most and where they are working the least amount of time during each week
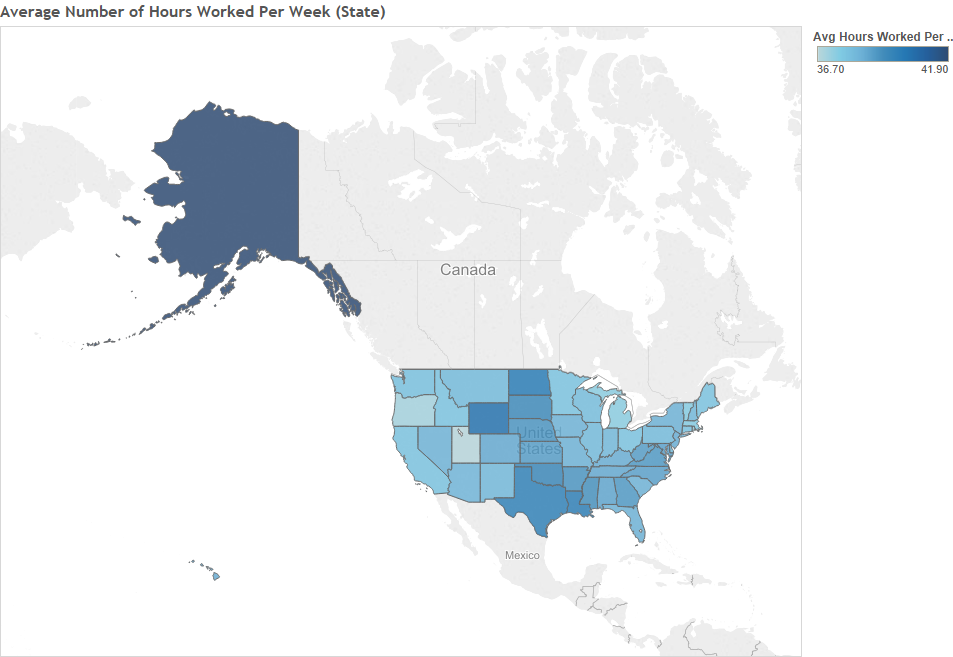
Quick Facts
State with Highest Average: Alaska, 41.9 Hours Per Week
State with Lowest Average: Utah 36.7 Hours Per Week
County with Highest Average: Aleutians East Borough, Alaska; 68.8 Hours Per Week
County with Lowest Average: Lexington City, Virginia: 30.2 Hours Per Week
County with Workforce of More than 50,000 People with Highest Average: Onslow County, North Carolina; 44.4 Hours Per Week
County with Workforce of More than 50,000 People with Lowest Average: Hampsire County Massachusetts; 33.7 Hours Per Week
All the totals above can be found from manipulating the visualization above. Let us know what cool trends and facts you can find.
How many hours do you work a week? Let us know in our exclusive survey.
Source
The information displayed above comes from the American Communities Survey, 2013 5 Year Estimates which is published by the US Census Bureau. These figures can be found on Table B23020 at http://factfinder.census.gov/
