Visualization
Data Notes
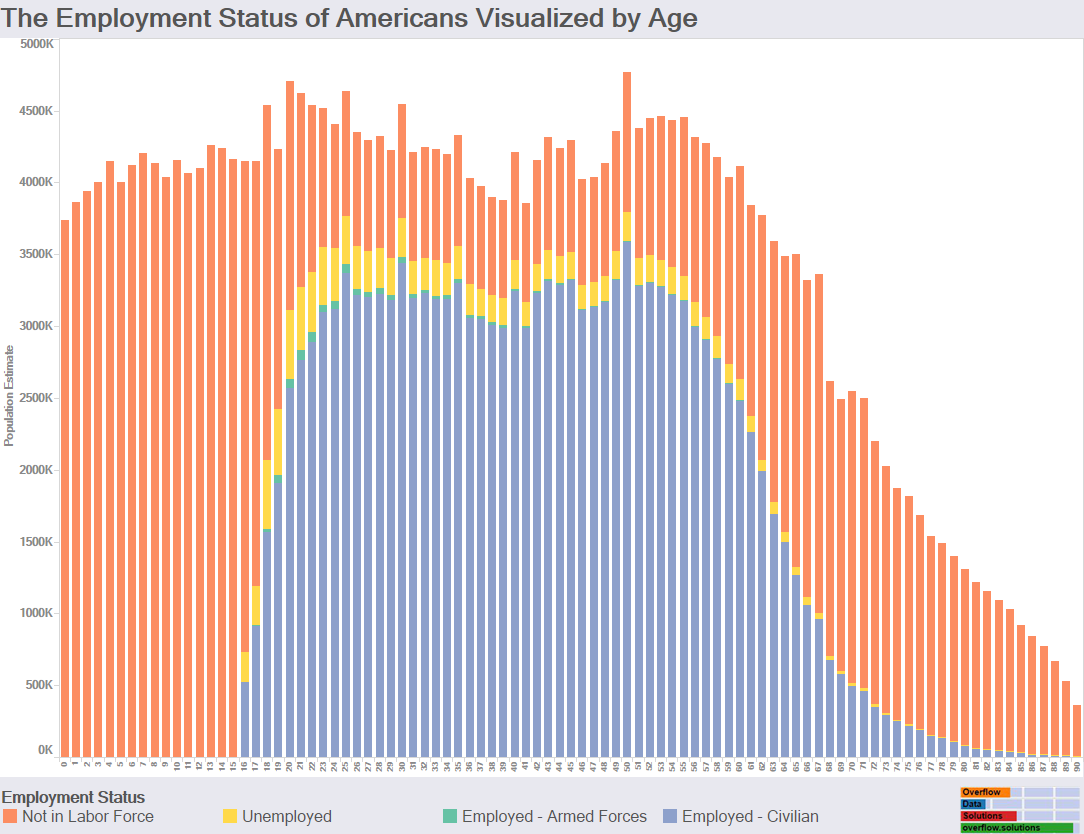
A couple weeks ago, I published a graphic showing how marital status changes with age. I decided to do another one showing how employment status changes as well. This visualization uses Tableau to show the employment status for every age.
The data for this visualization comes from the American Community Survey which is completed by the US Census Bureau. I used the 2014 One Year Estimates Public Use Microdata Sample which can be found on the ACS Website.
If you want to keep up with our surveys and data analysis, be sure to follow us on Twitter and Facebook.

1 Comment
Should I presume those high points on a 5 year repetition come from groupings in the source data?