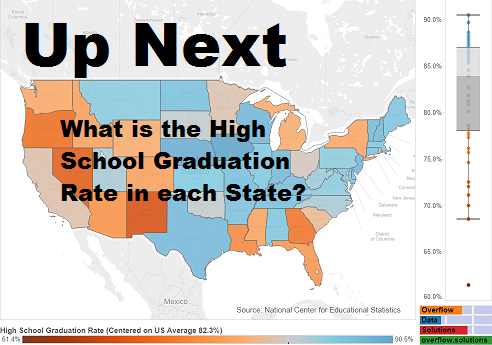
Introduction
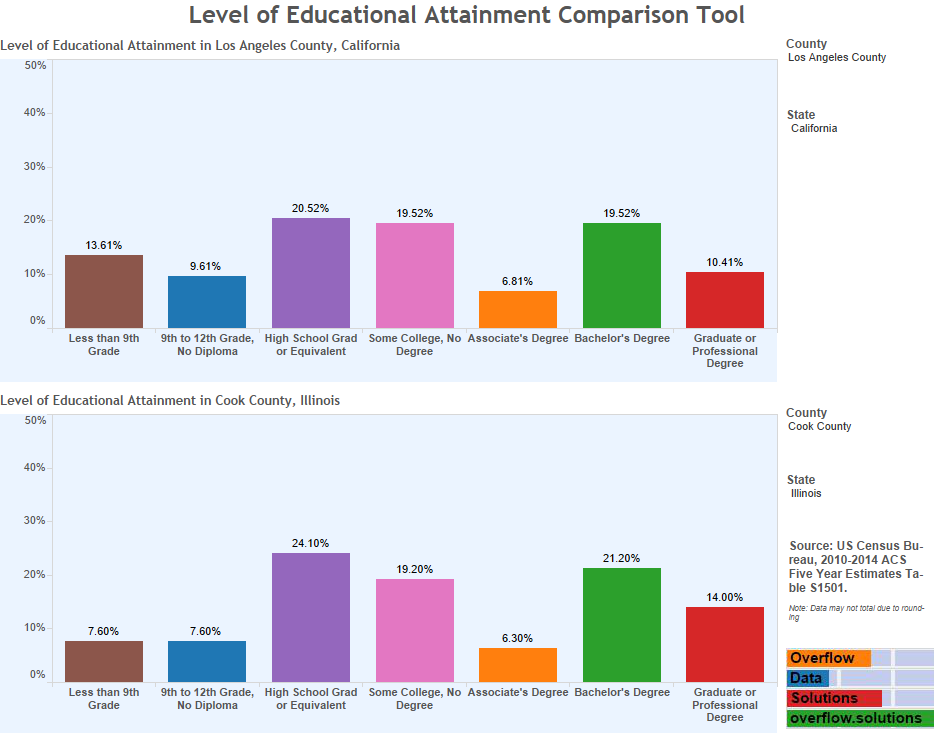
We love comparing counties and states so we made a tool that lets you do it with the level of educational attainment. Below you are able to compare every county, state, and the country state to see what percentage of the county has each level of education.
It is currently set to Los Angeles, California and Cook County, Illinois, (The two most populous counties) but as long as you are on you are at a desktop or laptop you should be able to adjust the filters to what ever counties and states you would like.
Visualization
A note for mobile users: The image below is a statistic representation of a visualization tool I created. Our site noticed that you are a mobile user, and since mobile platforms are unable to handle the visualization, you were routed here. We hope you enjoy this preview of the tool and that you will come back while using a laptop or desktop to try making your own comparisons. We have added a few of our favorite comparisons to view.
Los Angeles County, California v. Cook County Illinois
 The State of California V. All of the US
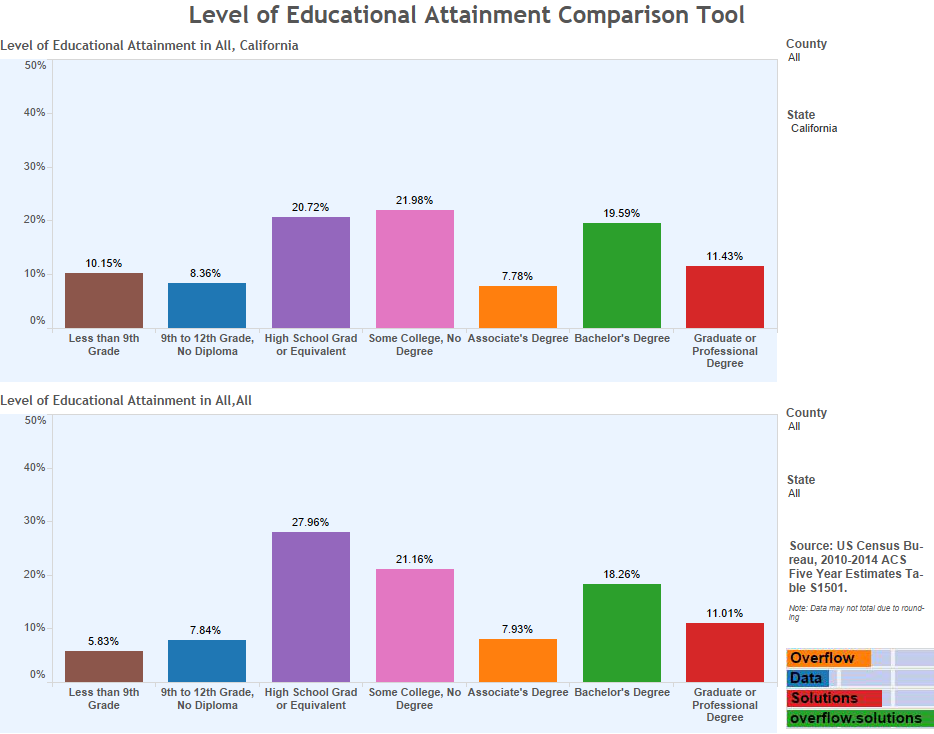
The State of New York V. All of the US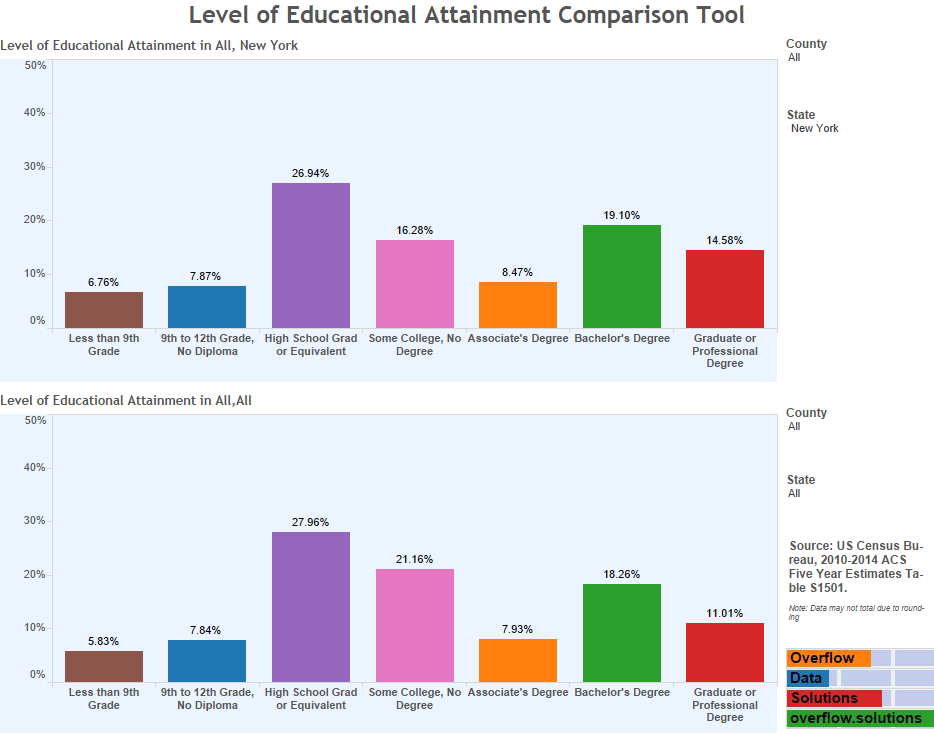 Washington D.C V The Rest of the US
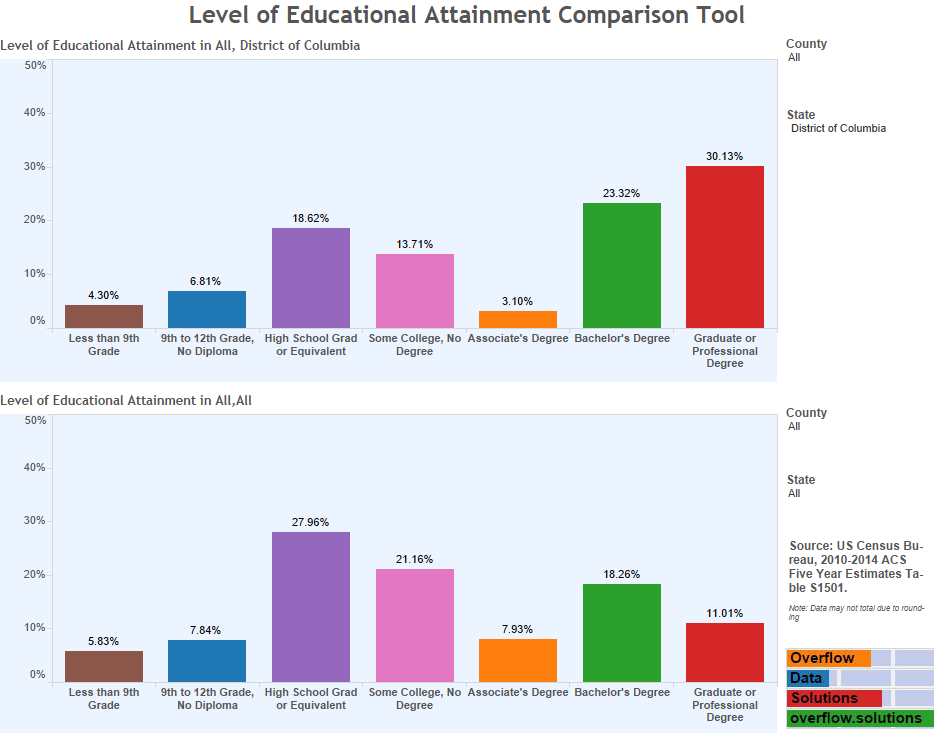
Visualization Controls and information
Geographic Filters
You are able to filter the data by both county and state. You can also remove the filters to see what the national average is.
Export Tools
There are a number of export tools the tool is equipped with. You can export a pdf or image from the download button in the bottom right. If you have Tableau, you can download this workbook by clicking the link in the top right. Tableau makes free copies of Tableau Public available to anyone that is interested in it.
Source
The data for this visualization comes from the US Census Bureau, 2010-2014 ACS Five Year Estimates Table S1501. The data was loaded into Tableau and was used to create the visualizations, add the filters, and create the tool.
Note: Data may not total due to rounding
Further Interactions
If you want to keep up with our surveys and data analysis, be sure to follow us on Twitter and Facebook.