Introduction
The American Community Survey provides a vast amount of data about the American people. Information about income, the veteran population, age, and more than 40 other topics is published by the Census Bureau each year. Taking a closer look at this data also allows you to make other inferences about the population, such as how many people living in America were “born at sea”.
While the idea may seem laughable, our analysis found that approximately 440 Americans claim they weren’t born within any country, but instead were born out in international waters. Where these people live and how we came to this estimation is detailed below.
Visualizations
In What States Do People “Born at Sea” Live?
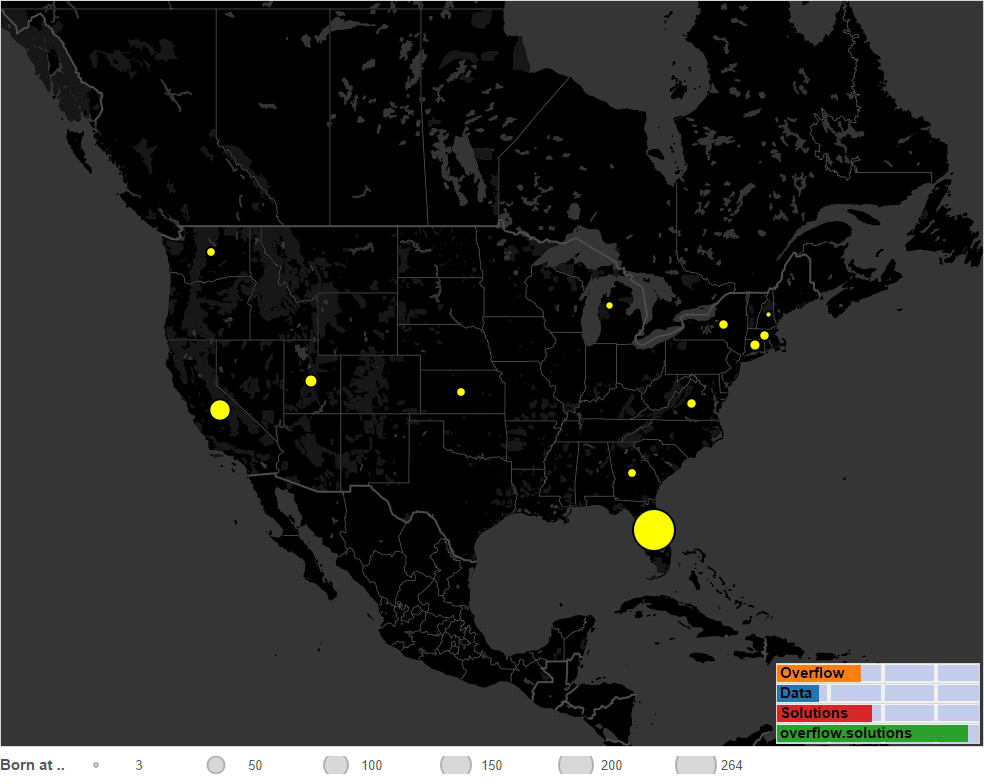
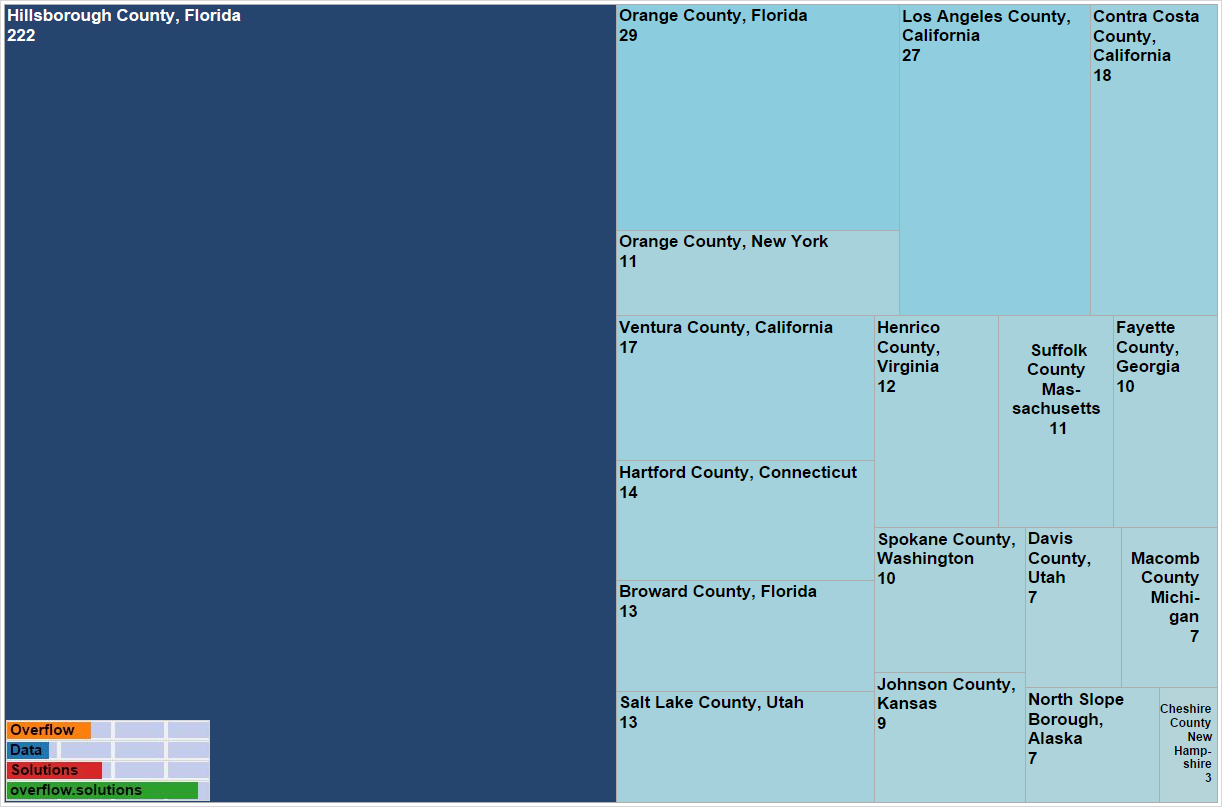
In What Counties Do People “Born at Sea” Live?
Methodology and Considerations
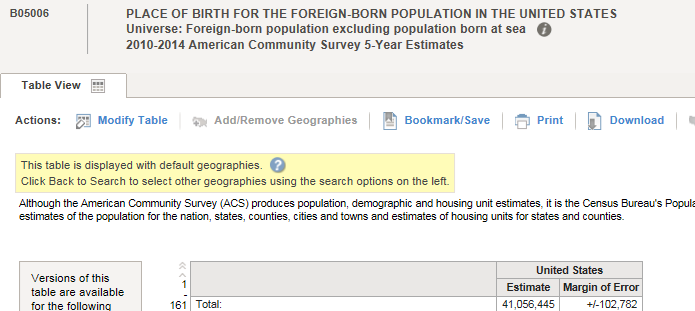
As you can probably guess, the Census Bureau doesn’t publish a data table on number of people born at sea. This figure is something that had to be calculated using two tables that the Census Bureau does publish, Table B05006, Place of Birth for The Foreign Born Population in the United States, and Table B05002, Place of Birth by Nativity and Citizenship Status.
My initial interest in this subject came after observing that Table B05006 had a “universe” that did not contain “population born at sea”. At this point I decided to note the number of foreign born individuals on this table which was 41,056,445.
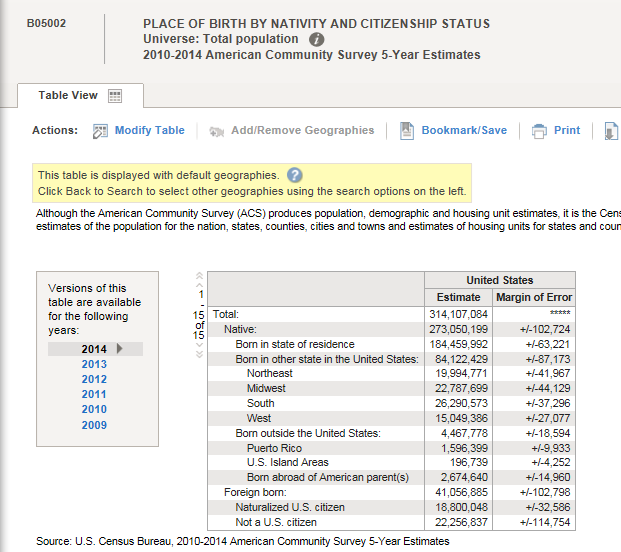
After getting this information I moved on to try and find a table that did not have this limitation on the universe. I was able to find Table B05002 which stated that the universe was the total population. From that table I came up with the total number of foreign born individuals in the United States, 41,056,885. From there it was just simple subtraction.
4,1056,885-41,056,445=440
After doing that I wanted to see where these people lived. So I just utilized the geography function on American Fact Finder to break out the table by county. Performing this same process for each county in excel lead to the data presented in the visualizations above.
Its important to note that this 440 number is only an estimation. The American Community Survey implements statistical methodology such as sampling,imputation, and weighting in an effort to devise these figures. I believe this may be why Hillsborough County has such a large proportion of this population as compared with other areas. It is most likely something to do with the statistical methodology used. This number could be significantly lower or higher depending on this.
Also, after reviewing the mail questionnaire I was unable to find this as a response option. This means that this is likely only discussed with individuals that have their data collected using another method. This may make this number lower than it may be if individuals that answer this using the mailing feature knew it was an option.
In conclusion, this was a fun way of finding some data within the data, but isn’t a very reliable estimate and shouldn’t be treated with the same esteem as a product that is published by the Census Bureau.
Source
The data used in this visualization was gathered from American Fact Finder and originates from the American Community Survey. As detailed in the methodology these figures were derived from subtracting the totals provided in Table B05006, Place of Birth for The Foreign Born Population in the United States from Table B05002, Place of Birth by Nativity and Citizenship Status. Both of these tables are 5 year estimates for 2010-2014. I would also like to point out that these figures are not official figures published by the Census Bureau. They are only derived figures from manipulating their data tables.
Once the data was found, it was manipulated in Excel and Tableau was utilized to create the visualization.
