Visualization
Data Notes
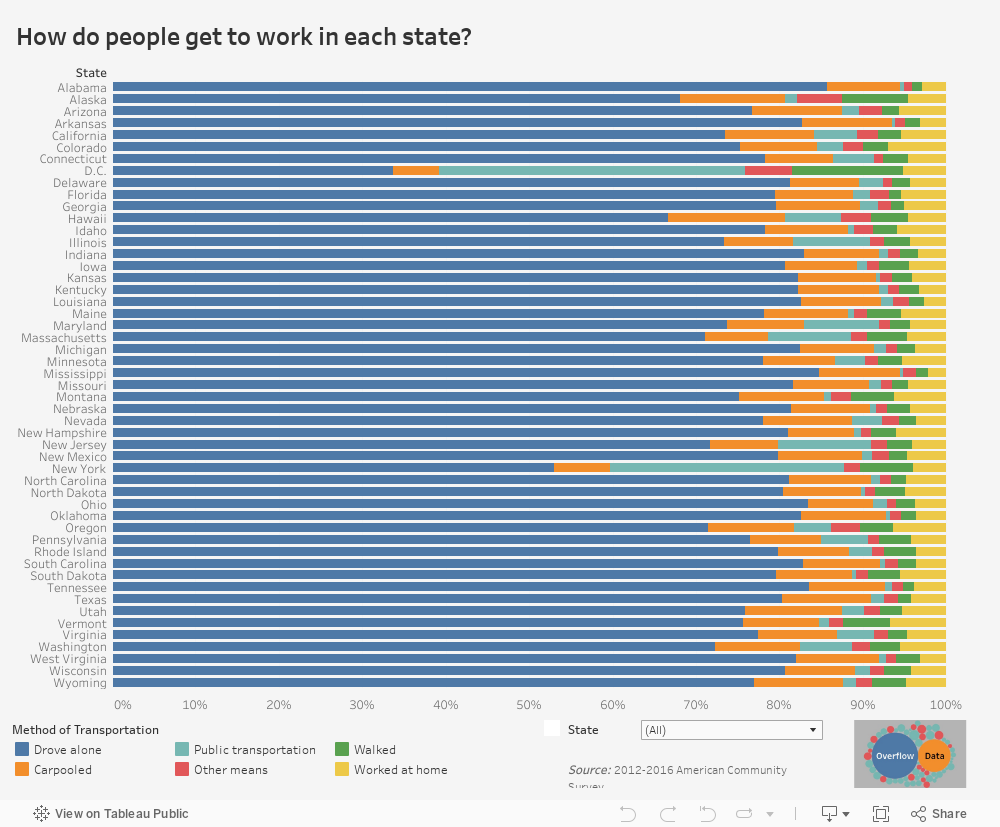
The data for this visualization comes from the American Community Survey which is conducted by the U.S. Census Bureau. I used the Census Bureau API to pull the 2016 5 year estimate for the commuting mode to work. Once I had gathered the data, I used Tableau to create this visualization.
I have included the API code I used to pull the data below. You will need a free API key to access the data. You can find out more at the Census Bureau’s Developer Page.
https://api.census.gov/data/2016/acs/acs5/profile?get=NAME,DP03_0019E,DP03_0020E,DP03_0021E,DP03_0022E,DP03_0023E,DP03_0024E&for=county:*&key=
If you want to keep up with our surveys and data analysis, be sure to follow us on Twitter and Facebook.
How do people get to work in each state? #vizintooltip #dataviz https://t.co/lFa84pialo pic.twitter.com/w47mF01Z9I
— Overflow Data (@overflow_data) January 19, 2018