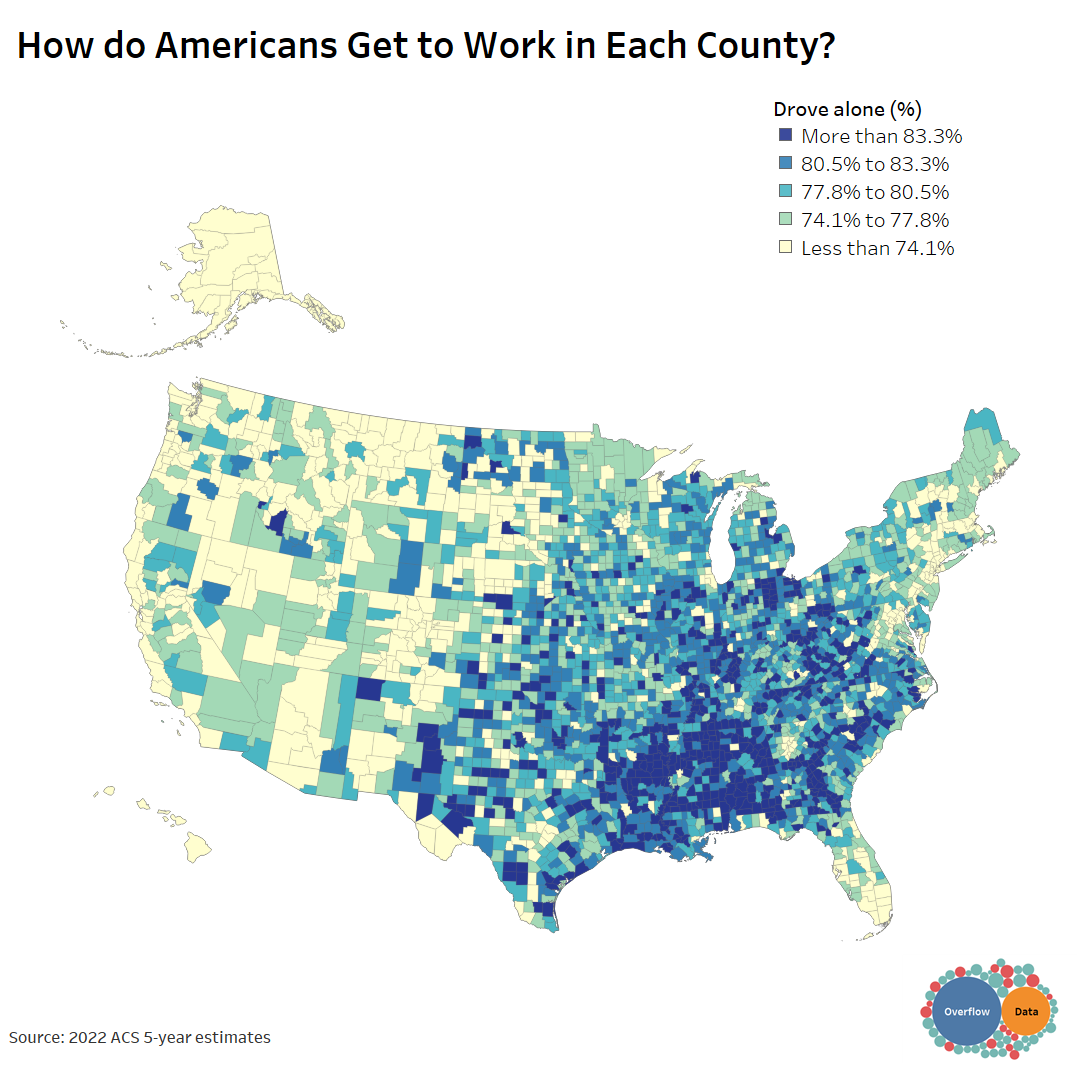
In Which U.S. Counties Are Households Most Likely to Lack Vehicle Access?
Explore U.S. counties with highest percentage of households without vehicles. Uncover local trends in our data visualization.
Commute times can differ throughout the nation for many reasons. This data visualizations shows the places with the longest commute times.
More people are working at home because of COVID-19. This visualization shows what percentage of workers were regularly working at home in 2018.
America is full of long commutes, especially in urban areas. This interactive data viz shows where the worst commutes are in the country.